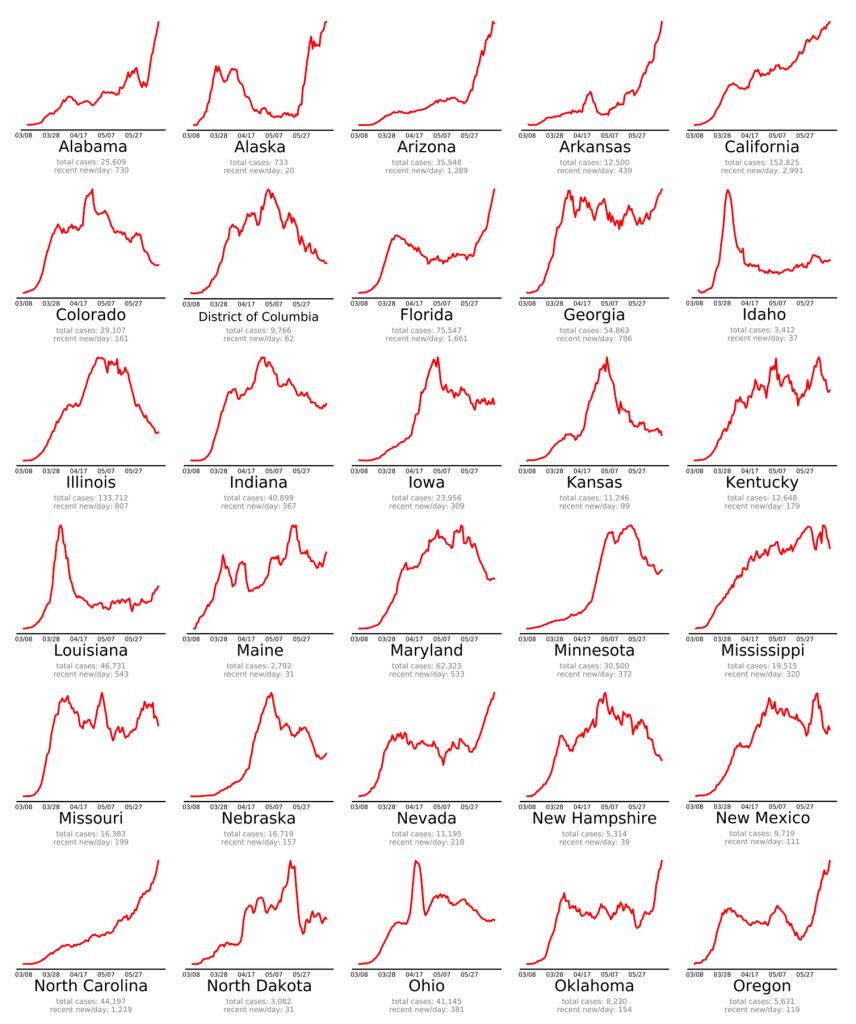
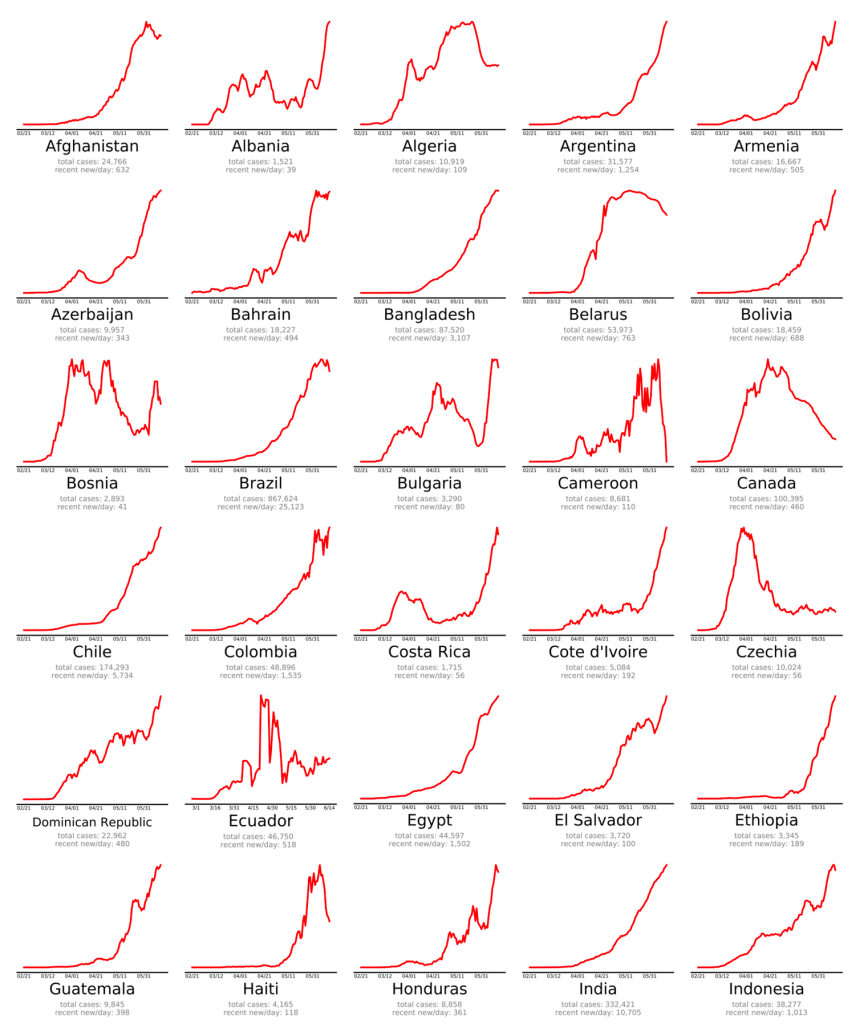
This is a case update. New confirmed cases are starting to trend upward for the US again for the first time since about April 9. In 19 US states, the Rt number is higher than 1.0, suggesting that the virus is spreading in these states. On endcoronavirus.org, you can clearly see recent spikes of new cases in some states, and in many countries.


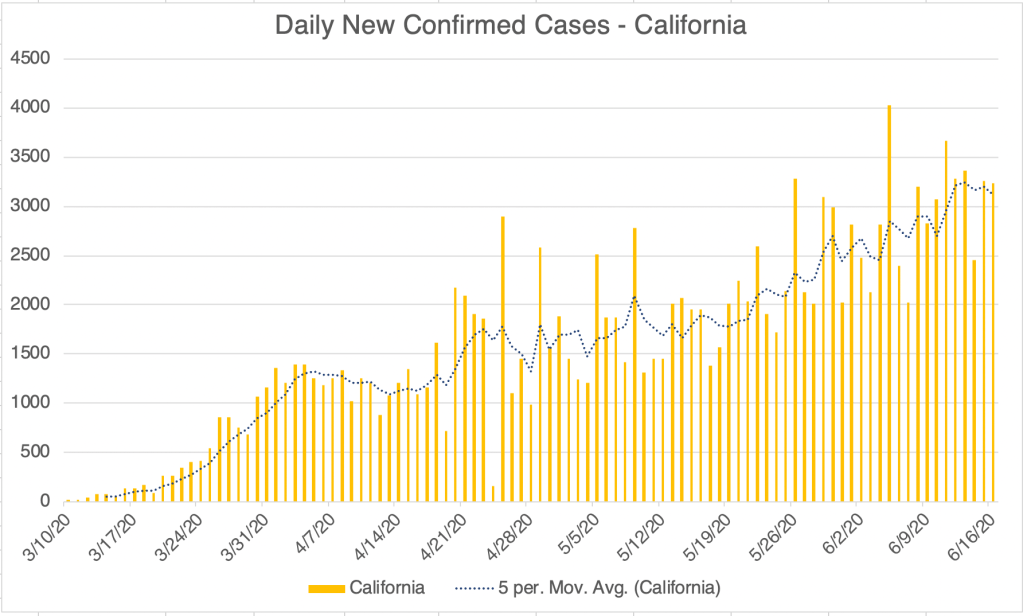
In California, the number daily new cases continues to accelerate. San Diego has started to go up too. San Diego County has started to publish the number of recovered patients. My graph of cases in SD County now includes active cases, taking recovered people into account. Some of these points of data on my graph are given by SD County, the others are calculated by me based on the data points. Looking carefully at the SD County data, the number of recovered people is approximately the number of total cases from 17 days previous. The suggestion is that it takes approximately 17 days to recover after being confirmed as a COVID case, so I’ve made a similar calculation for California. Just to be clear, in my graph of active cases in California, the data points are based on assumptions about recovery time, not actual data.

For San Diego, active cases have been hovering around 2,000 for several weeks, without much change, but for an increase in the last few days. For California, we’ve seen a steady trend upward in active cases from 20,000 in early April, to 40,000 cases today. There are of course lots of potential reasons for these increases, from gradual re-opening to the protests and riots stemming from the George Floyd incident. I was once optimistic that the first wave of cases would be over this Summer, but new trends have called this into question. I’m now feeling totally unable to predict how things will go.
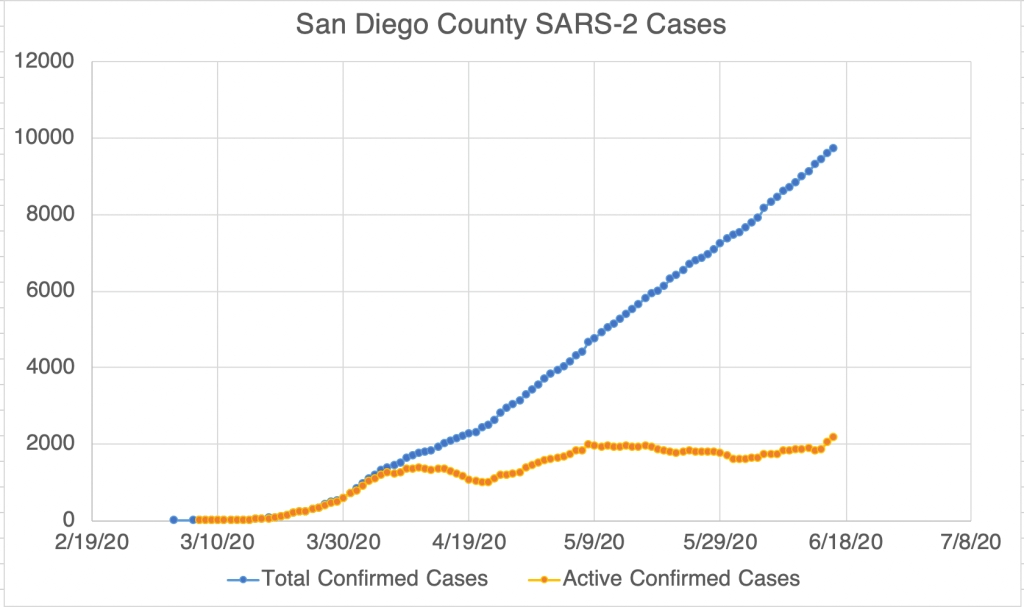
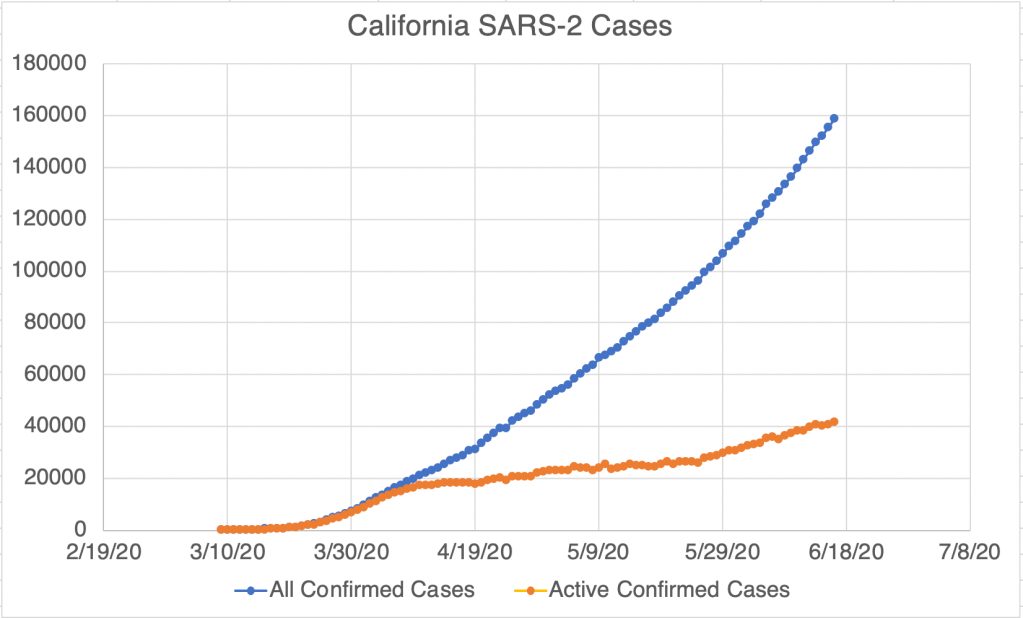
Active Cases assumes that those cases confirmed 17 or more days ago have recovered.
I heard a radio commentator talking about a recent study that I haven’t been able to find. The study said that while Social Distancing account for maybe a 50% drop in new cases, the lockdown accounted for only a 5% additional drop. Given the economic and social cost of the lockdown, the study suggested they were not on the whole worth the cost. If you’ve seen the actual study, please post it in the comments!
So please continue to social distance and wear your masks in public! But it’s time to figure out how we can get the economy running again! We have big problems to solve, time to get to work!
Don’t fear, but be smart,
Erik
