Some people have commented on my faith. I find that most people these days, Christians and secular people alike, misunderstand this term. So this very long post will be about what I think faith is, and what is the grounding for my faith. This will help you understand my perspective on my current situation. Given that I am a scientist and a Christian, two things which many think are at odds, you may have more understanding about how I can be both of these things at once. I will also discuss the particular reasons that I think I will survive, even in light of yesterday’s post. You can decide for yourself if this belief is well founded. Christians should read this because I will introduce a definition of faith that you may not have considered. Non-Christians should read this at least so that you may understand why I have faith. Obviously, this post will contain a lot of Christian content. If you don’t want to read this kind of content, you can skip this post.
What is faith?
“Now faith is the assurance of things hoped for, the conviction of things not seen.” Hebrews 11:1
The famous atheist Richard Dawkins said “Faith is the great cop-out, the great excuse to evade the need to think and evaluate evidence. Faith is belief in spite of, perhaps because of, the lack of evidence.” Many Christians even hold a view similar to this. Their definition might be “Faith is believing in something without evidence or reason, but because of a religious leader or religious text.”
First, I’ll say that our faith should never be based on a pastor, teacher, or church, because all too often, these things can fail us. Rather, our faith/trust should be in God alone.
I would also say that there is really no such thing as blind faith in God, since all faith is based on something.
The word “faith” is used in a bunch of different ways in our culture. Biblical faith can best be thought of as “trust”. Practically everywhere you see the word “faith” in scripture, swapping in the word “trust” can help you understand what the word properly means. My friend Rob Andrews coined the phrase “Trust based on Truth.” We have ample evidence that we can trust in God, so our trust in God is not blind.
As for scripture, there is a lot of evidence that the bible can be trusted. This evidence falls into categories including archeology, history, textual transmission, internal consistency, pragmatism, wisdom, and harmony with the natural world. I hold that scripture can be used as evidence for Christianity because it is trustworthy. Some would say using scripture is not evidence, but simply blind trust in a book, while I would say that if a book is trustworthy, and the Bible is, then believing in it is not blind faith. A defense of the reliability of the Bible is too long for this post, so I’ll leave it at that for now.
Is God trustworthy? Why can we trust God? First, I count scripture as evidence that can be used to support our trust in God. Some think that trust in scripture is “blind faith”. I would argue that since there is evidence for the trustworthiness of scripture, then scripture can be used as evidence. I understand that many of you are agnostic or atheist, and don’t hold the Bible as being trustworthy. Aside from the broad categories of evidence I’ve already mentioned, we will need to leave that large discussion to another time.
Second, I also count the character of God as evidence for His trustworthiness. Some find trust based on God’s character to be blind faith.
I would argue that God Himself uses His own character as evidence that He can be trusted, or evidence that we should have faith in Him.
The Ten Commandments start out like this, in Exodus 20: “1Then God spoke all these words, saying, 2 ‘I am the Lord your God, who brought you out of the land of Egypt, out of the house of slavery.’”
To paraphrase, God is saying “I am good, powerful, and have your best interest in mind. Plus, I did you a solid. For all these reasons, you should follow these rules.” God is appealing to His character as reasons they should trust Him. He’s also asking them to remember events they just saw with their own eyeballs over the past few months. He is not asking them to trust Him blindly. He has given them plenty of evidence that He is trustworthy before He lays the Commandments down on them.
Repeatedly, God tells the Israelites to “remember” what He has done for them in the past. The Jewish holidays, the monument by the Jordan, the altars on Mount Gerizim and Mount Ebal, all exist so that they will remember these things. God wanted them to remember these things so that they will trust Him!
I have found this very useful in my own life. Whenever I am facing a trial or a difficult decision, I recount to myself all the times that God has pulled me up from the ledge, given me a flash of lightning so I can momentarily see in the darkness, or paved the way before me. Remembering these things helps me know that He will be with me in my current trial!
I found something fascinating when looking for the word “remember” in the Old Testament. From Exodus onward, God uses this word to ask the Israelites to remember Him. But in Genesis, the bible uses this word differently. “But God remembered Noah”. “I will remember My covenant…”. “Then God remembered Joseph.” Before God asks us to remember what He has done for us, He remembers His promises to us, and is faithful (trustworthy) to keep His promises! Before He asks us to trust Him, He demonstrates that He is trustworthy!
Now to the verse that defines faith, Hebrews 11:1. “Now faith is the assurance of things hoped for, the conviction of things not seen.” We could read this in at least two ways.
“Now blind faith is the assurance of things hoped for, the conviction of things not seen.”
“Now trust is the assurance of things hoped for, the conviction of things not seen.”
Many Christians will affirm that the first sentence is the proper way to read it. In fact, they see Hebrews 11:1 as confirmation that this view is correct. I would argue the that second way allows us to understand the meaning of this verse. Our trust in God allows us to see through a situation and know that God will keep His promises to us. Our trust is in God, and He is our assurance. It is because of Him that we have the conviction of things not seen.
I think many understand the word “faith” to mean “belief”. Belief is a mental ascent that something is true. While believing that God is true is certainly a good thing, I would suggest that this way of viewing faith doesn’t go far enough. You can believe something with your mind, but trust requires that you put that belief into action. You can believe that a surgeon can safely take out your appendix, but you need to trust him to actually put on the gown and the little booties and get on the table.
What does blind faith require of us? What does belief require of us? I’m not exactly sure. But trust requires that we believe in God enough to live out our life in a way that honors Him, even when He asks us to do difficult things.
Read John 15. Jesus says that if we love him, we will obey His commands. This requires trust!
In I Samuel 13, Saul and his army are at war with the Philistines. The prophet Samuel had told Saul to wait for his arrival to make a sacrifice to the Lord, and then begin the battle. Even as King, it was not Saul’s place to make a sacrifice. Seven days went by, and soldiers started to leave. Saul finally decided to make the sacrifice without Samuel. In doing this, Saul took the battle into his own hands. He decided to lay aside the promises of God, and create for himself what blessings he could.
When we trust God and choose the difficult path He has laid out for us, we choose the blessings that God has laid along the difficult path. When we choose our own path, we are on our own. We must create our own blessings. We aren’t very good at creating blessings.
We encounter this kind of challenge all the time. God asks to be honest, to be fair, to treat people with kindness. So when we lie to a client to make a sale, we are telling God that we know better than Him how to behave professionally.
To have a mature faith, one that can sustain the great opposition of the world, allow us to be obedient when God tells us to do something very difficult, or endure suffering, we must place our trust in God alone. Trust in anything else just won’t do.
This is my definition: Faith is acting on the plentiful evidence that God is trustworthy.
A note about COVID: I’m going to make some Christians mad here, but hear me out. During COVID, I sometimes heard Christians quote Psalm 91. This chapter gives encouragement to believers who are in danger, demonstrating that God has the power to save them from dangerous situations. It’s a great and true message! But many Christians misapplied this message during COVID. Yes, God can and does protect us from danger, probably much more often than we know. But God also made sure the book of Proverbs was included in the Bible. Proverbs encourages us to be wise, and to make decisions carefully. God does not promise to keep us out of all danger. So yes, we should trust in God, but we also need to use our heads. Placing ourselves in needless danger is not a demonstration of our faith. “Do not put the Lord your God to the test.” – Deuteronomy 6:16
We can trust God for the promises He actually makes, but we can get ourselves in to trouble if we trust in promises He didn’t actually make. We should trust God, but also use our heads. This view is encapsulated in the phrase I use to end all of my posts. “Don’t fear, but be smart.”
“I have told you these things, so that in me you may have peace. In this world you will have trouble. But take heart! I have overcome the world.” – Jesus of Nazareth, John 16:33
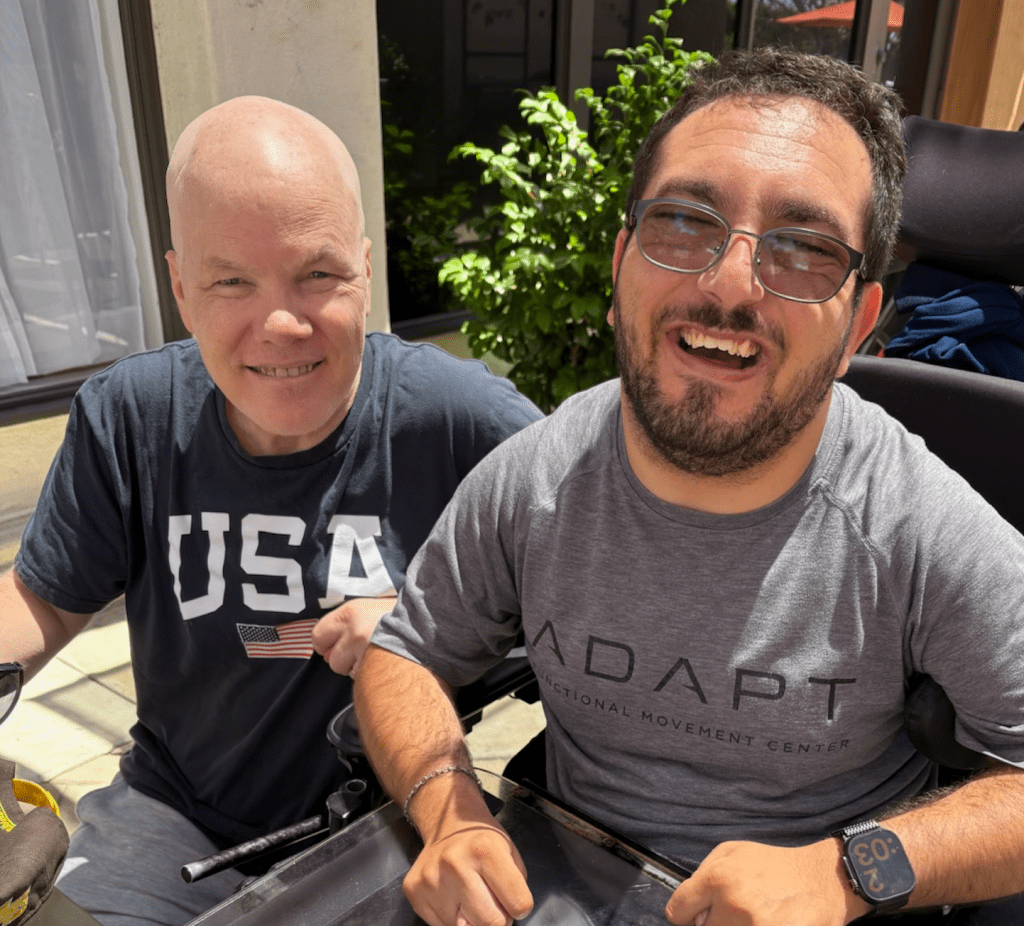
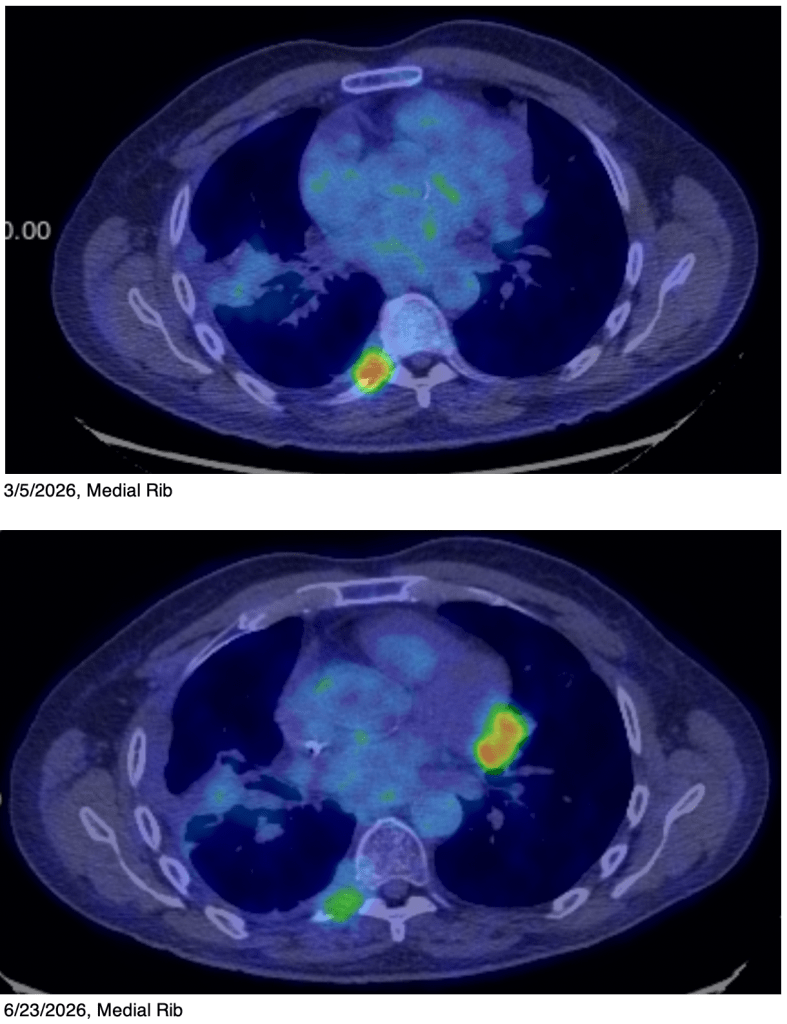
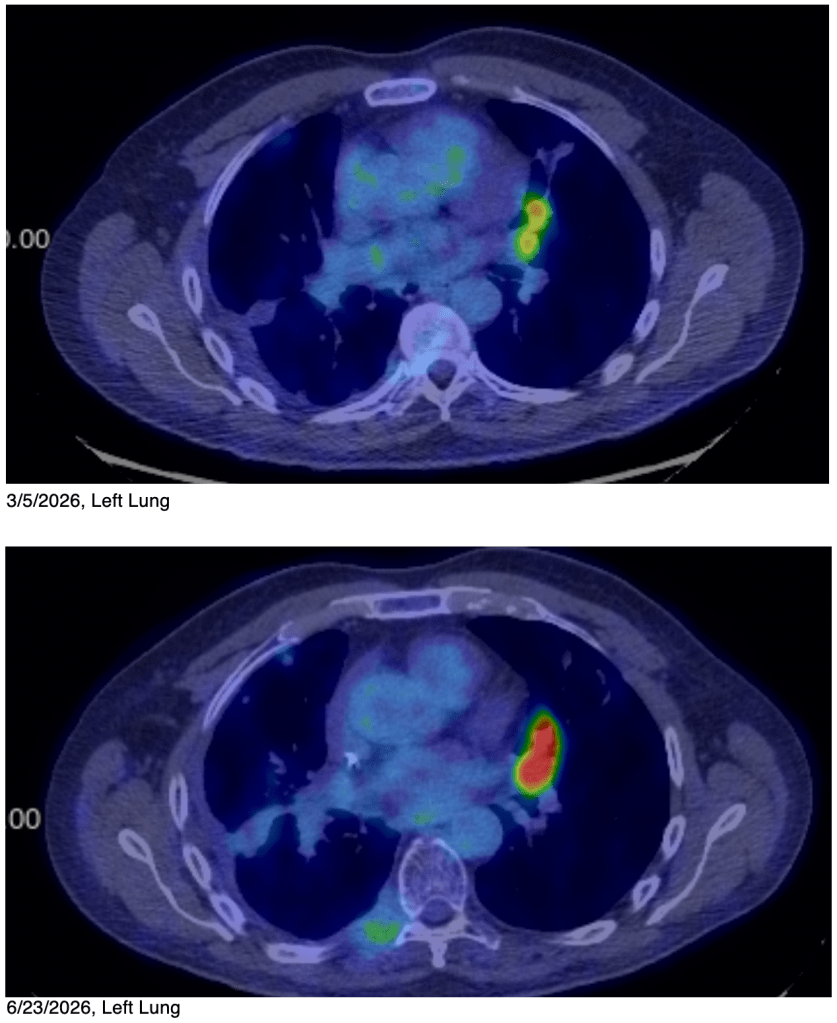
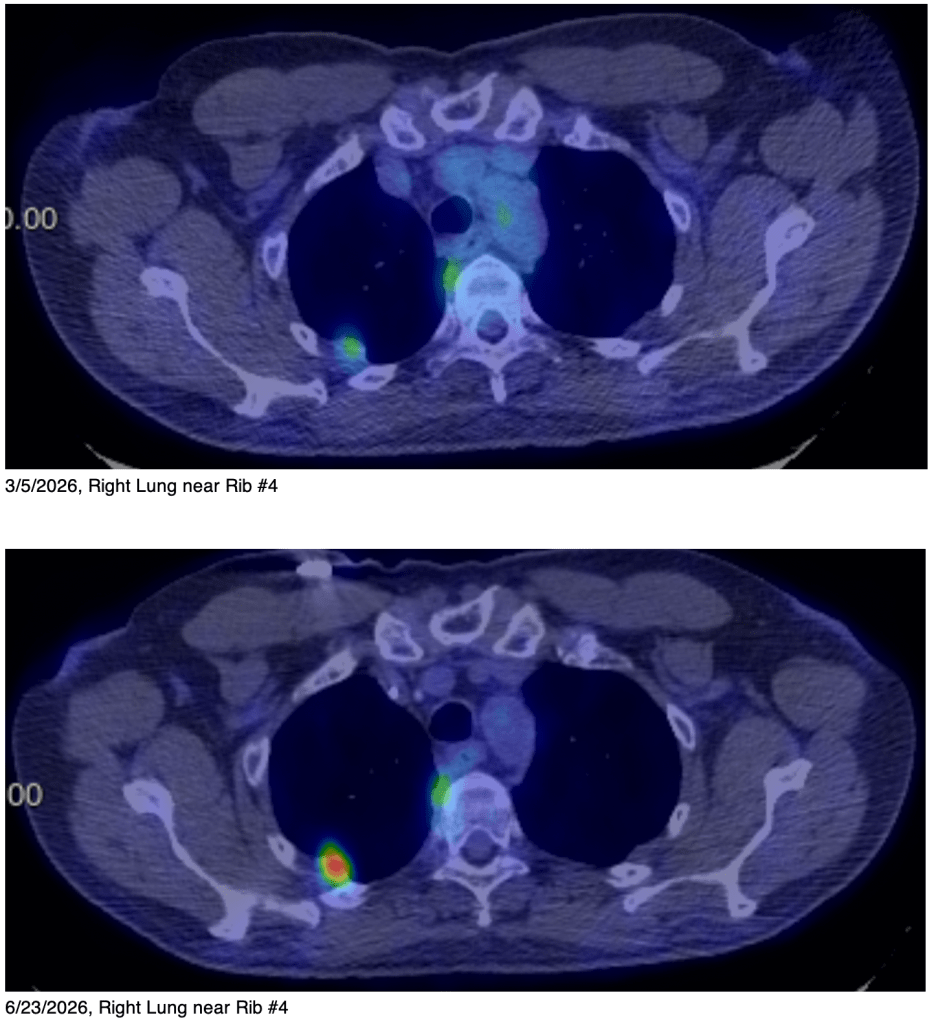
Why do I believe I will survive? Now that I’ve defined faith, the question is, why do I believe I will survive? I will tell you that it’s not because I think I’m a good person or that I have some right to survive. Plenty of high quality people have died before their time, even John the Baptist and Jesus of Nazareth. I have a good friends right now who are struggling with serious health issues, and I don’t have any more right to survive than they do. I lost a very dear friend to cancer just a few days ago. I can assure you that I have no greater right to survive than he did.
What I’m going to say next will be controversial among non-Christians, and even among many Christians. I wrote way back in Cancer Update 4 (September 26,2024) that God told Kathy that I needed to broaden my diet while in the hospital. At the time, I was barely able to walk to the end of my bed because I wasn’t making enough adrenaline. I figured that I needed to eat a wider variety of fruits and vegetables so I could get more biochemicals, I was released in just 2 days! I also wrote about how you can know if God is talking to you.
During my journey, several people that we know and trust have told me things that God gave to them suggesting that I have things to do after I have recovered. You may ask, how do you know these people are trustworthy? That is a really good question and is worthy of consideration.
In the Old Testament, God had an extremely high bar for prophecy. If a prophet was ever wrong about something, they were to be executed. For Christians in the New Testament, the bar is lower. Christians are to use discernment to judge if a word is trustworthy, comparing it to scripture to make sure it is consistent. Modern Christians can have very different standards. Some are skeptical and rarely believe the things modern “prophets” say, while others are quick to believe modern prophets. Many will say that modern prophets are only human and sometimes make mistakes.
While I believe some modern-day prophecy is legitimate, if someone says something that turns out to false, I reserve the right to never believe them again. They are either not hearing from God and just making it up, or they are misinterpreting what God told them and they have poor judgement. Either way, I am under no obligation to trust them.
Here is another story illustrating that at least some of this is legitimate. During the early days of my illness, I was throwing up regularly, once or twice a day. This was very inconvenient as I lost meals and even medications and lost 40 pounds. Kathy became alarmed with how much weight I had lost and was becoming desperate to slow down this trend. Then one night, on October 13, 2024, I had gone to bed at around 9:30. Kathy couldn’t sleep and was praying for me about my weight loss. At about 11:30, God told her that there was a spiritual battle happening in our house. He instructed her to pray for me in a particular way, and even to have me pray as well. She didn’t want to wake me up, and asked God to wake me up for her! She came into the guest room where I was sleeping at that time to pray and wait for to me to wake up.
Meanwhile, I had a dream. I was tied to an incline bench, the kind at the gym that holds your upper body at an angle. A band-saw blade was spinning around me. The blade had the normal teeth on both sides, but also had cheese grater type blades on the flat sides. Additionally, it was covered with a diamond or glass dust. So in every conceivable way, this blade was very sharp and dangerous! No matter how I handled it, it would cut me badly. In the dream, I knew that the blade was starting to contract around me, and no matter how I handled it, I couldn’t stop it. I needed someone to save me! I woke up alarmed and saw Kathy sitting in a chair staring intently at me. She had been sitting there for 2 minutes. We prayed together, and I haven’t thrown up again since that night! Over the next few months, I gained back all my weight, and now I actually would like to lose about 10 pounds, like usual!
This is an example of the several times God has spoken to us during this time, and even saved my life!
To reiterate, several people that we trust have made statements to us in the last several months that I would survive. We trust them because they have been accurate in the past. Many of these people that we trust claim to have received these statements from God. I believe that I will survive not because of wishful thinking, or because I am misapplying encouraging scripture to myself, or because of denial, or simple optimism bias, but because we believe that God has promised it. You may point out correctly that my trust in this relies at least partly in my trust in the people who have spoken to me this way. I absolutely agree. If by chance I do not survive, it will not be because God lied to me, or because He is not powerful, but rather because these people either did not really hear God, or because they misunderstood Him.
Yes, we believe that God still speaks to people in modern times, because He has spoken to us.
Why am I going through this? Why do I have cancer when so many others don’t? Why will I survive when many good people around me have not? We don’t have the answers to all of these questions. We only see a piece of the reality around us. We can’t see everything going on, and we can’t see the final result from our perspective. My trust is not that my puzzle piece will not contain some darkness, but rather that the entire painting will be a thing of great beauty! Because of God’s character, I believe this trust is well grounded.
Proverbs 3:5-6 “Trust in the Lord with all your heart, and lean not on your own understanding, and He will make your path straight.”
Don’t fear, be smart, and trust in God,
Erik
Why do good people suffer?
What to do when you’re suffering.
If you want to subscribe to these posts, click on the “Subscribe” link on the lower right corner of this page. The link will also appear if you start scrolling up from somewhere in the middle of the page.
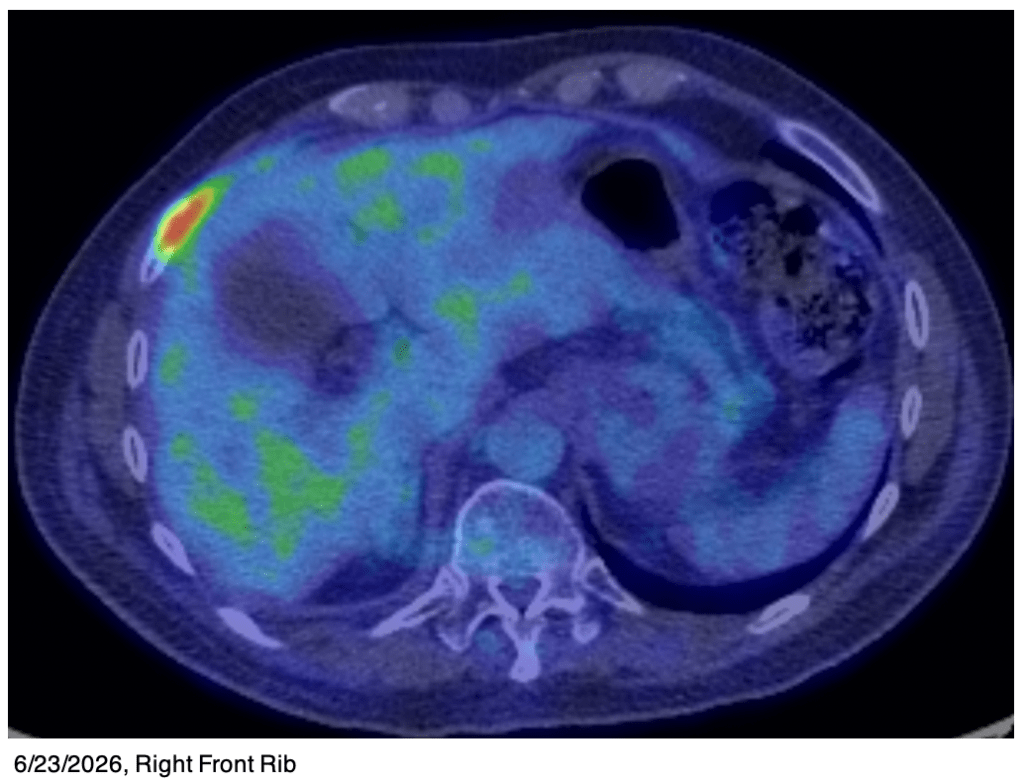
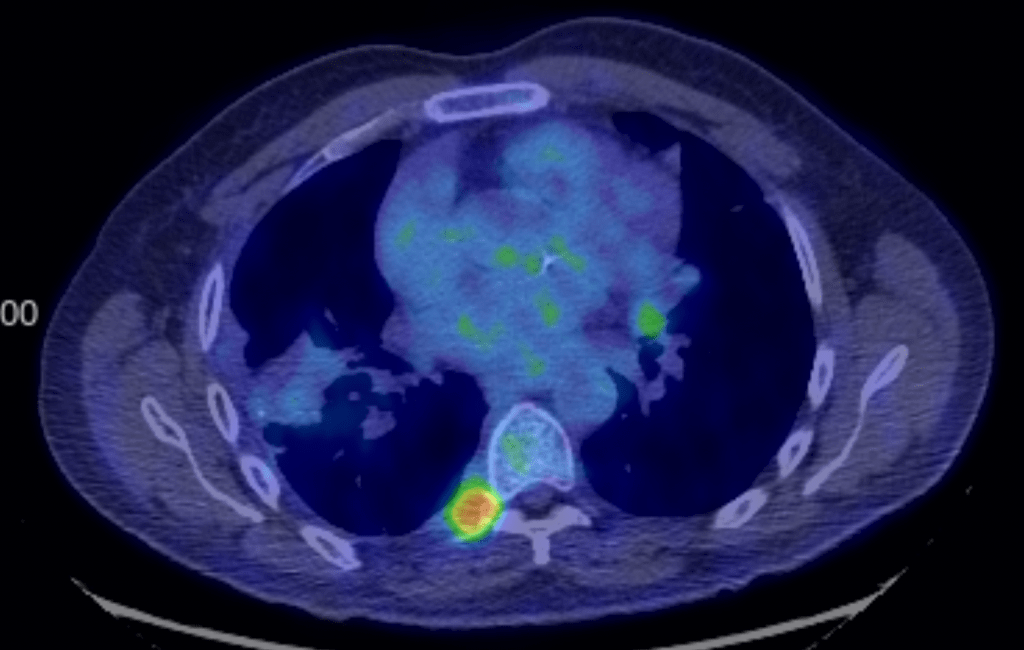
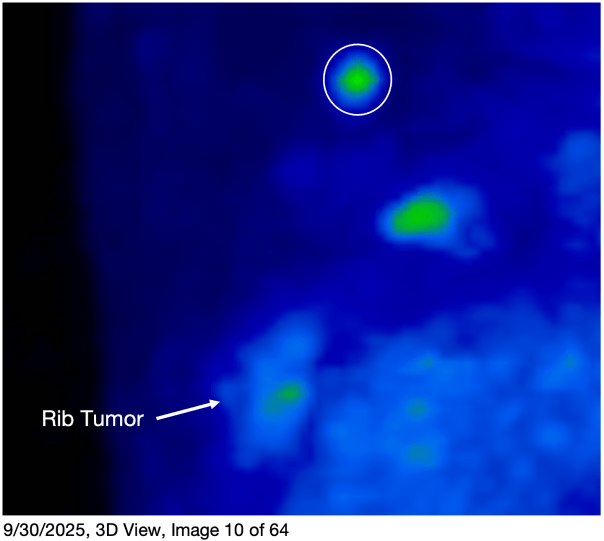
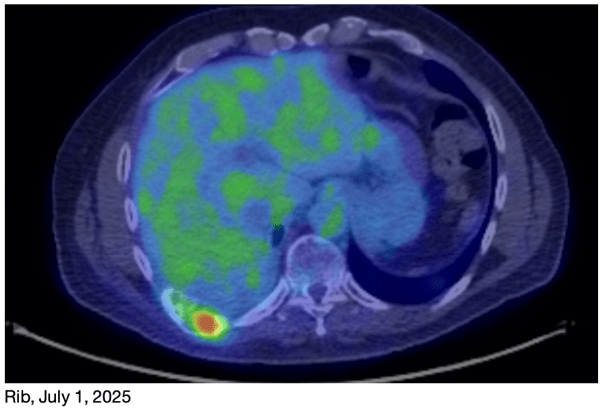
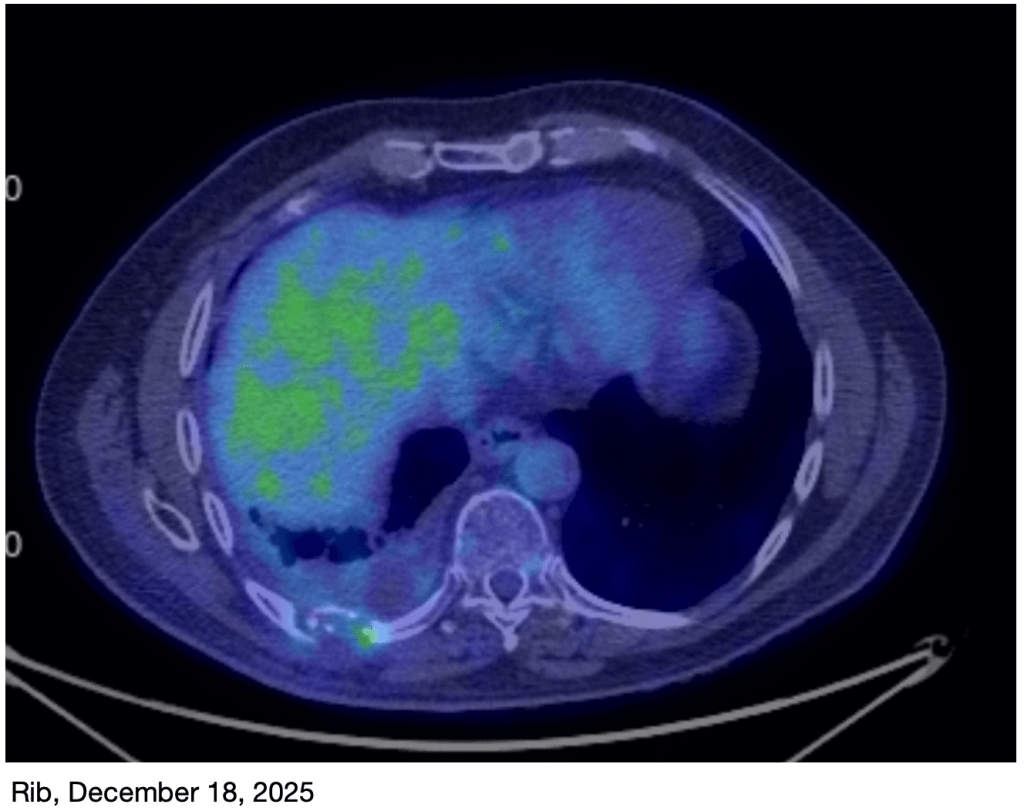
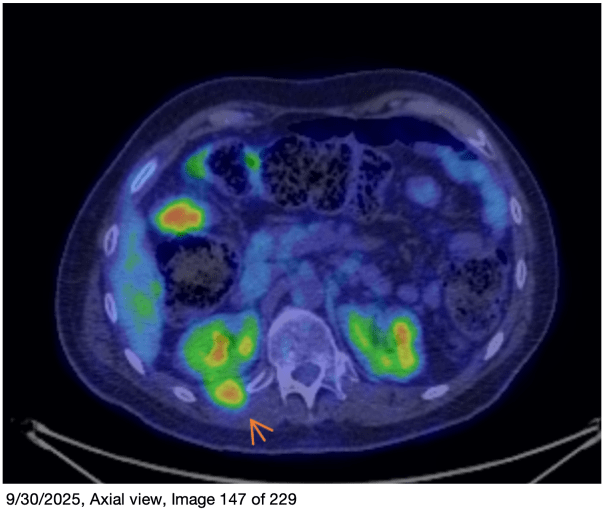
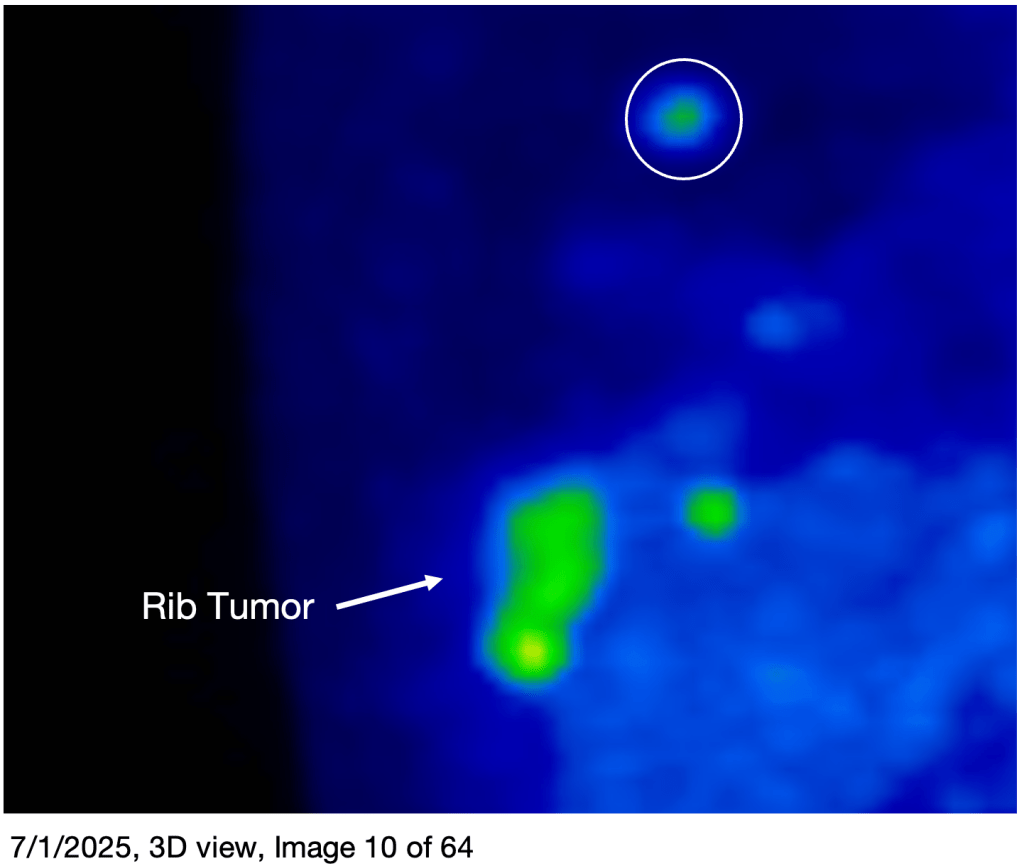
You can read all of my cancer updates here.