Case Update: September 30th, 2020

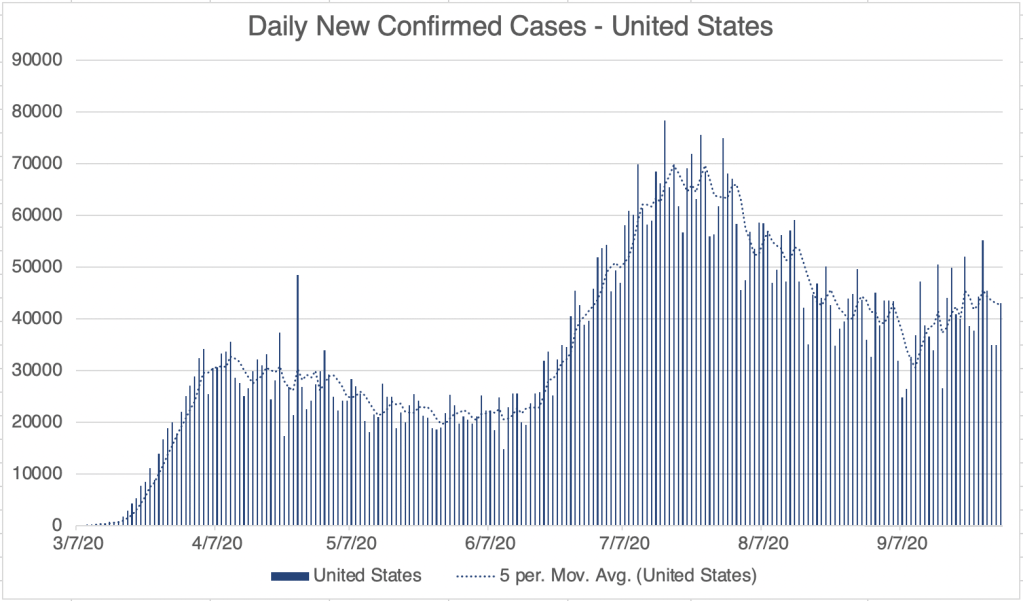
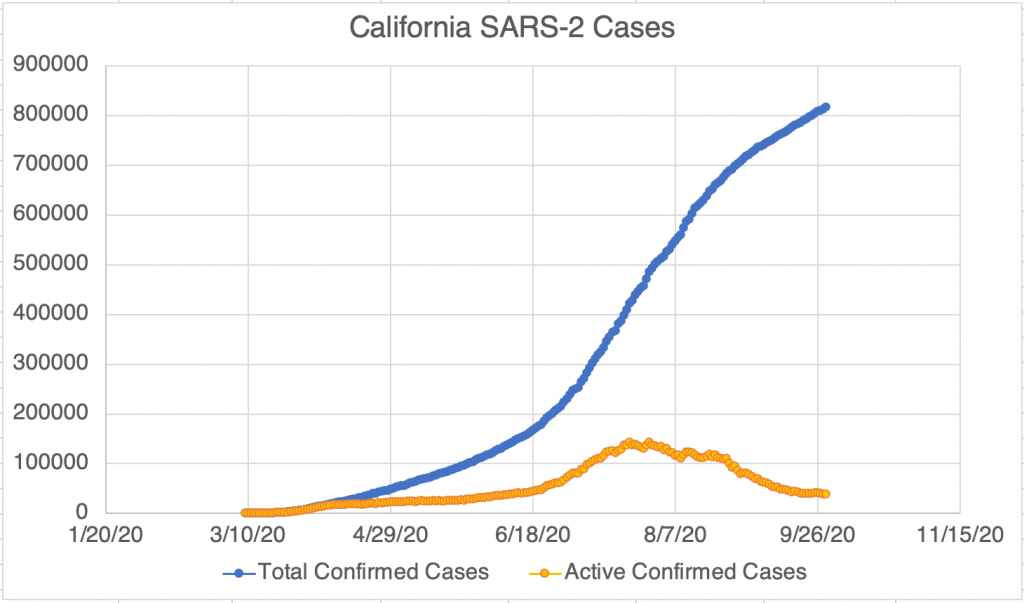
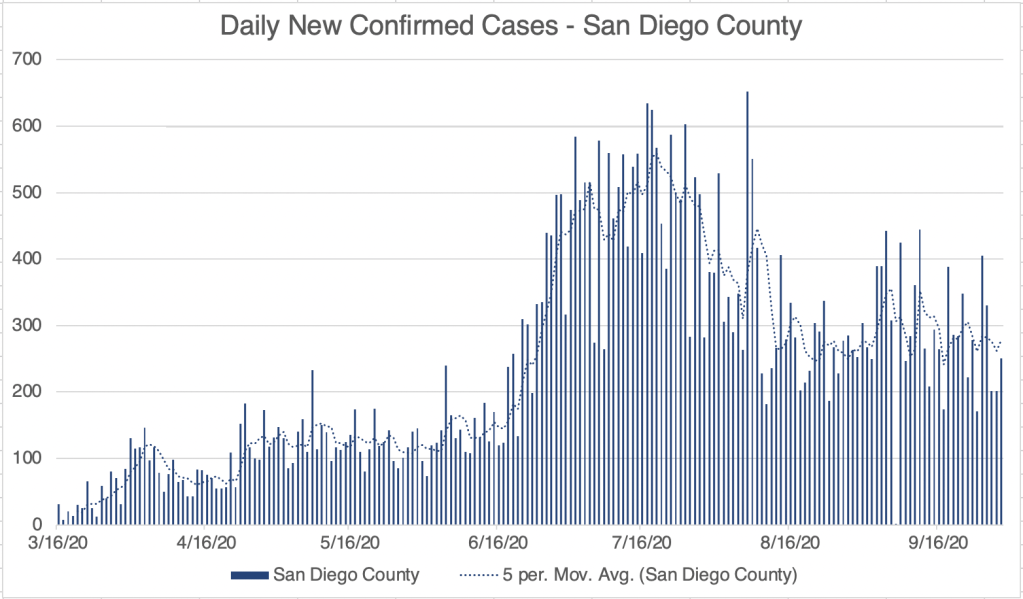
Here’s an update for today. The US, California, and San Diego County seem to have reached a “new normal” after the 2nd wave is over. All have a persistent rate of new cases, unfortunately higher than when the 2nd wave started. The US in fact is increasing in cases a little, with the Northern states having the largest new confirmed case load.

Graph is by me, from data collected from Johns Hopkins University COVID site.
Graph is by me, from data collected from Johns Hopkins University COVID site. “Active Confirmed Cases” numbers are calculated based on the assumption that patients confirmed to have SARS-2 virus at least 17 days ago have recovered.
Graph is by me, from data collected from San Diego County Public Health. See also regularly updated slides from SD County.
Endcoronavirus County Level Map, September 30th, 2020

India now has 6.1 million cases as compared to the USs 7.2, and they are just reaching their first peak now, so they will probably surpass our case load soon. This is confirmed cases of course, and there’s no telling now many non-detected cases they have. Of the countries with the top 10 number of confirmed cases, 4 are in South America, Brazil, Colombia, Peru, and Argentina. Mexico is also in the top 10.

Don’t fear, but be smart,
Erik

Leave a Reply

Fill in your details below or click an icon to log in:

WordPress.com Logo

You are commenting using your WordPress.com account. Log Out /  Change )

Facebook photo

You are commenting using your Facebook account. Log Out /  Change )

Connecting to %s