Case Update: February 10th, 2021

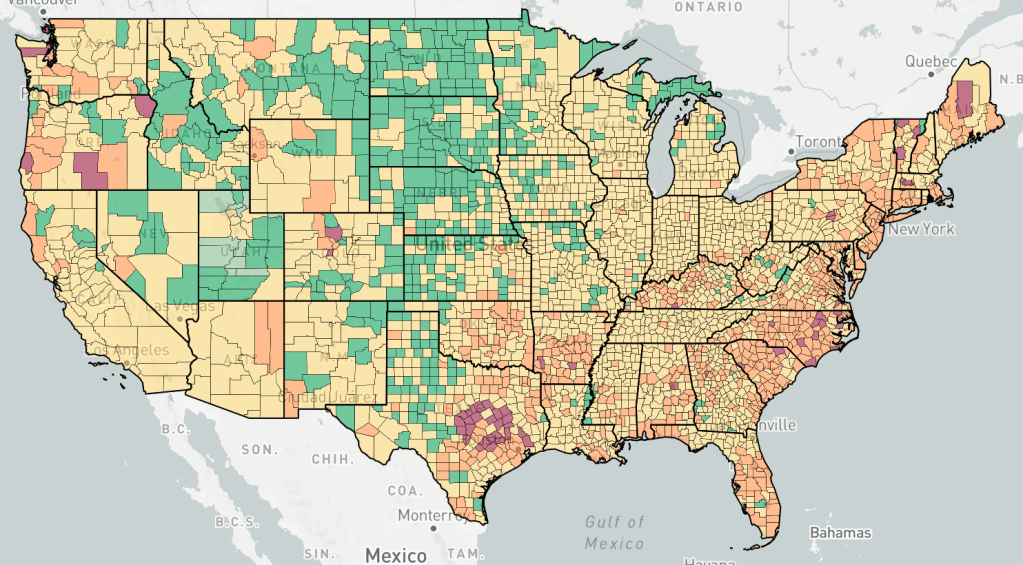
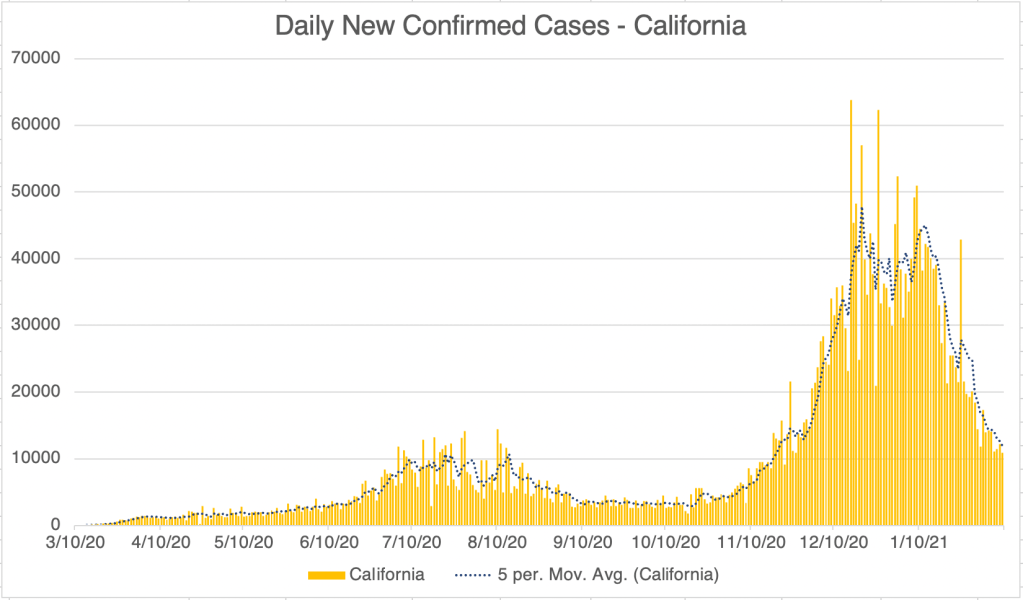
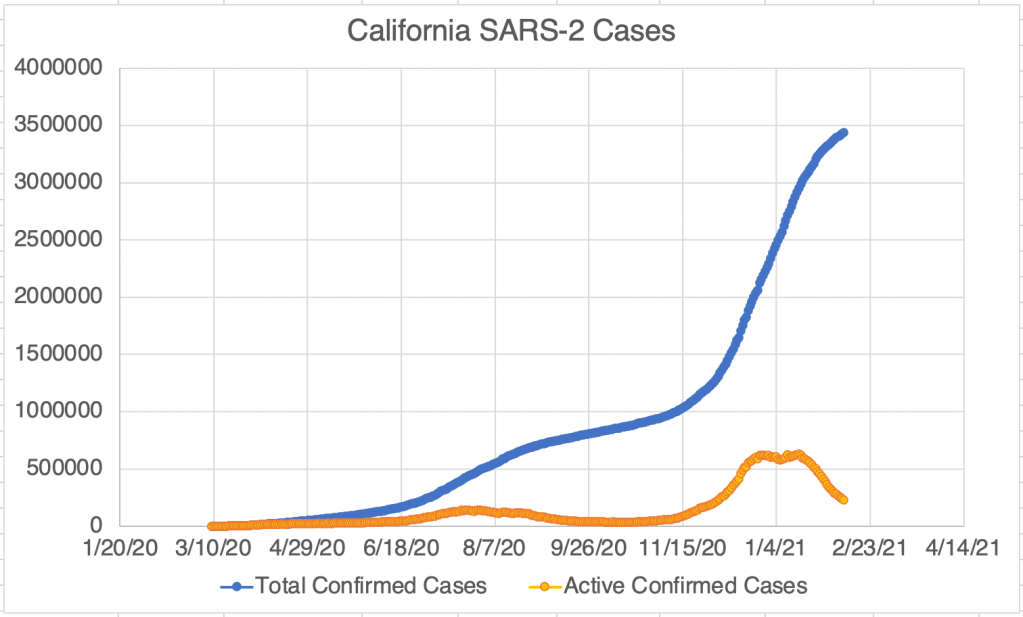
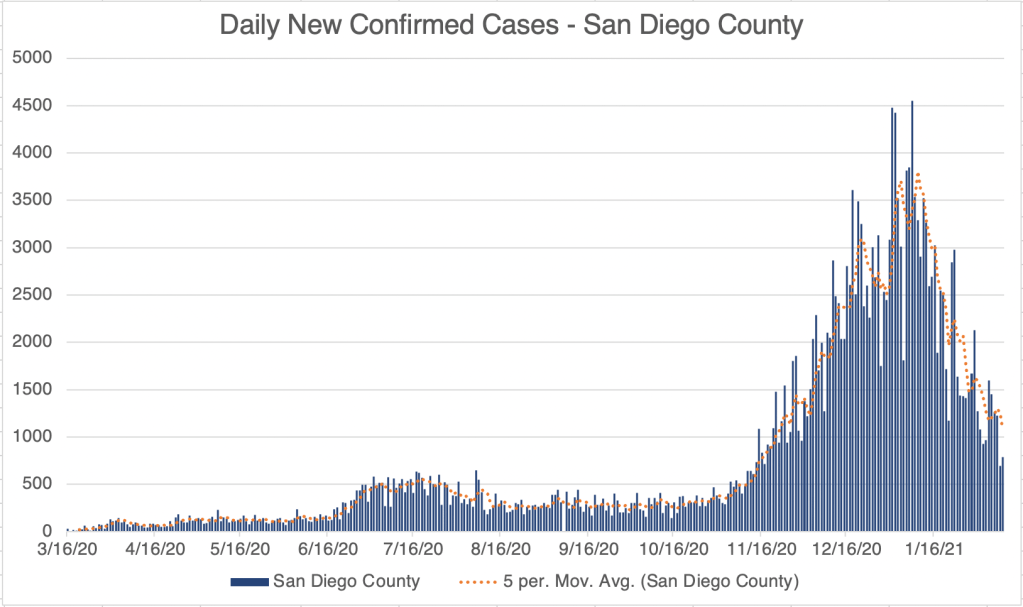
This is a case update. New case numbers continue to plummet for the US, California, and San Diego County. New case numbers are now similar to those in early November. Obviously, the number are still not zero, so we still have work to do, but we have good news. As an interesting side note, the endcoronavirus map of new cases reveals a little pocket of new cases spreading out from Austin, Texas! Other parts of the country are generally improving, and the central part of the country is doing particularly well.

Graph is by me, from data collected from Johns Hopkins University COVID site.
Endcoronavirus County Level Map, February 10th, 2021
Graph is by me, from data collected from Johns Hopkins University COVID site.
Graph is by me, from data collected from Johns Hopkins University COVID site. “Active Confirmed Cases” numbers are calculated based on the assumption that patients confirmed to have SARS-2 virus at least 17 days ago have recovered.
Graph is by me, from data collected from San Diego County Public Health. See also regularly updated slides from SD County.
Graph is by me, from data collected from San Diego County Public Health. See also regularly updated slides from SD County. “Active Confirmed Cases” numbers are calculated based on the assumption that patients confirmed to have SARS-2 virus at least 17 days ago have recovered.
Graph is by me, from data collected from Johns Hopkins University COVID site. This graph shows reported tests. Laboratories are currently required to report both to the ordering physicians and also report positives (without identifying information) to the CDC as well as county and state public health. Some labs have been late reporting to public health, which is why you see some days which have either a very high or very low number of tests.

Of course, we just had the Superbowl, which I count as an American cultural holiday. We may have had some new infections associated with gathering in peoples homes. If so, we may start to see numbers coming up starting on Friday or Saturday. After Thanksgiving and Christmas, new cases started to increase a little less than a week afterward.

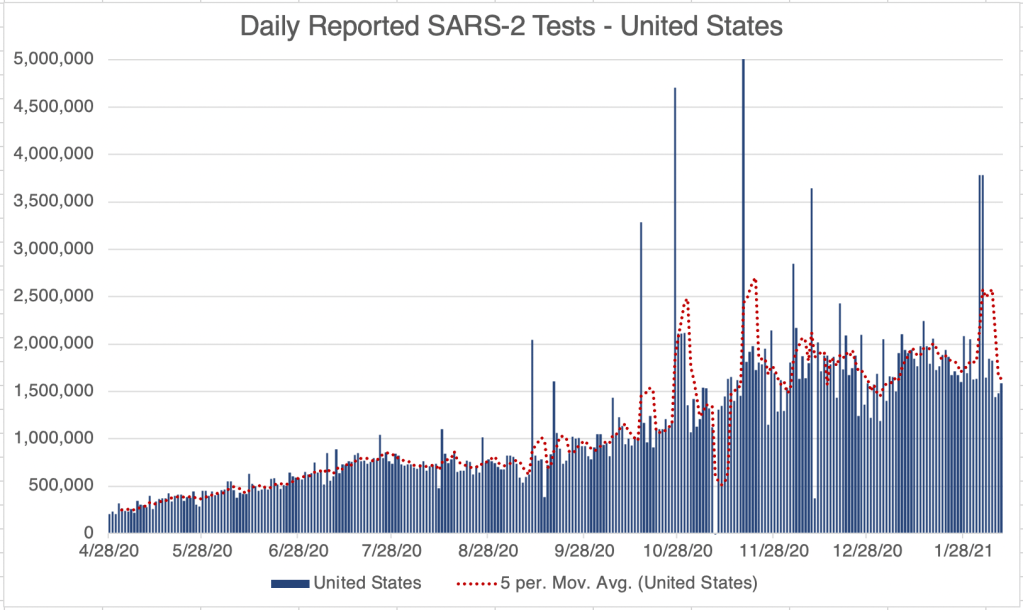
During the year, we’ve seen testing capacity come up slowly but steadily from just a few hundred a day when the CDC was trying to do all the testing themselves in March, to around 1.5 to 2 million per day in December ’20 and January ’21. Now that new cases are starting to come down, testing is just starting to head down as well. If you are a medical professional, especially in testing, you may begin to find it easier to buy pipette tips in the next month! We can only hope!

Don’t fear, but be smart!
Erik

Leave a Reply

Fill in your details below or click an icon to log in:

WordPress.com Logo

You are commenting using your WordPress.com account. Log Out /  Change )

Facebook photo

You are commenting using your Facebook account. Log Out /  Change )

Connecting to %s