Case Update, February 24th, 2021

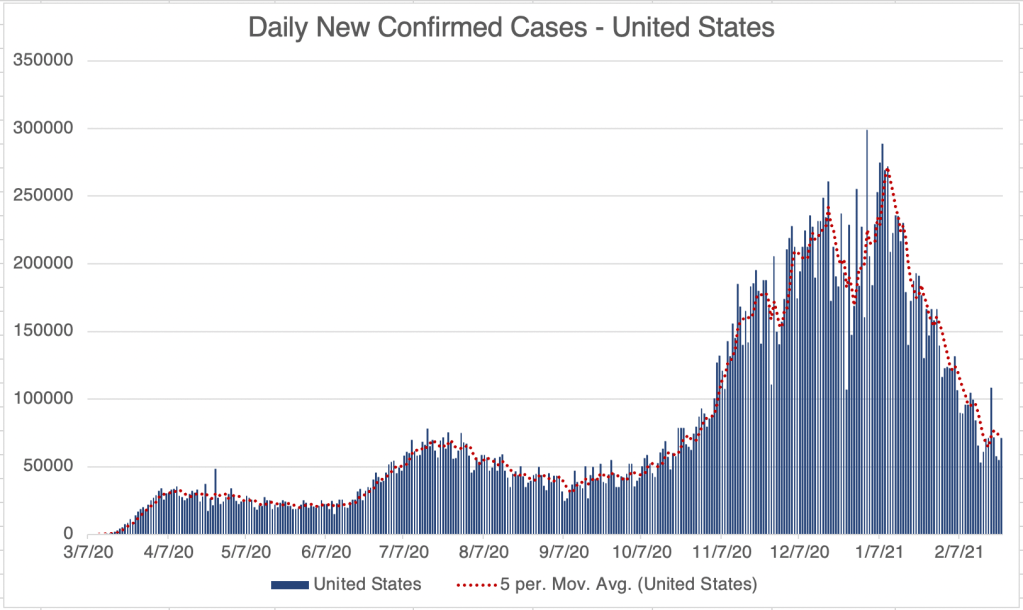
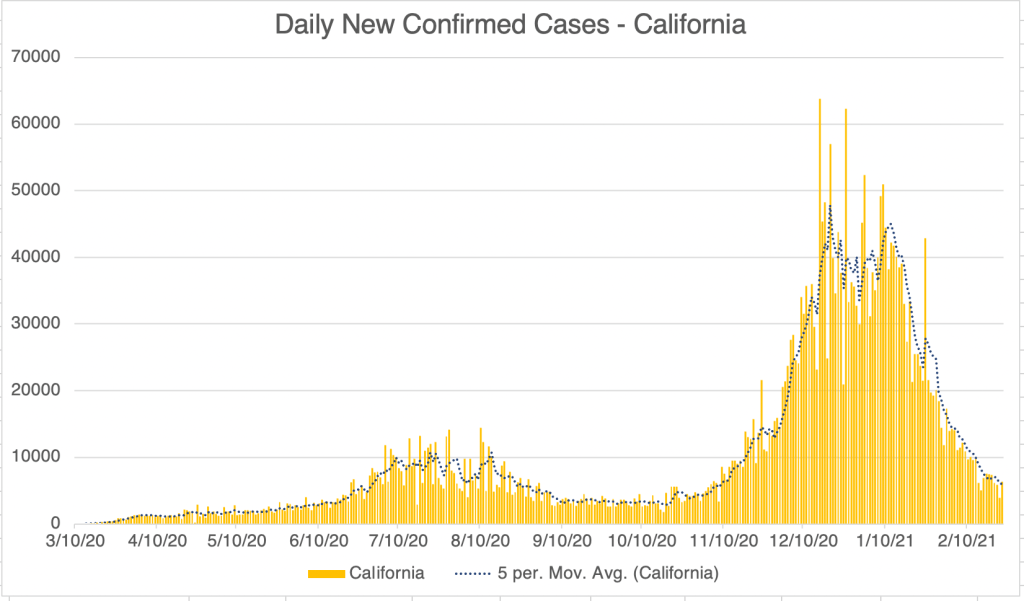
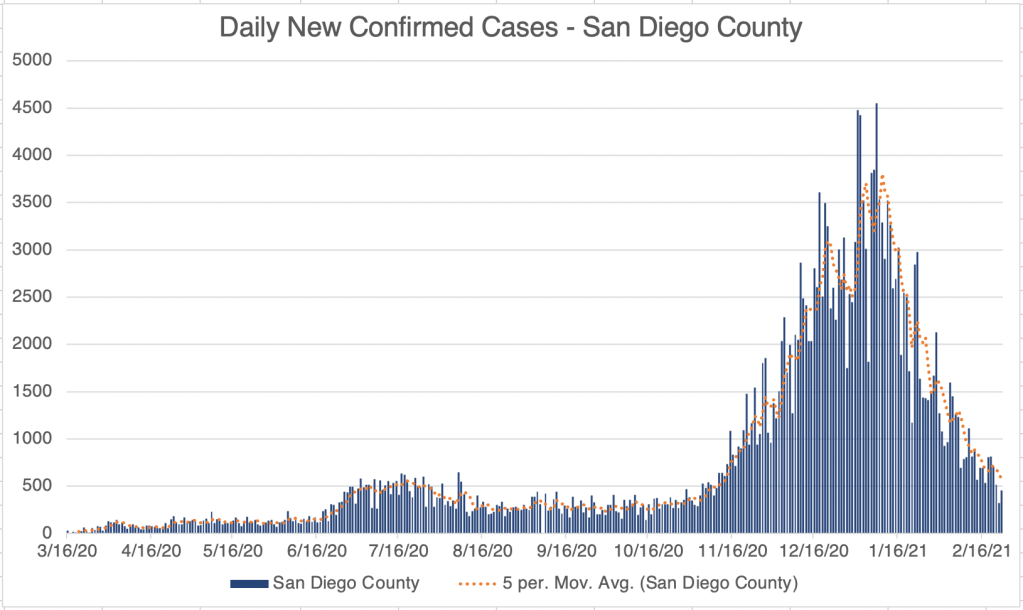
This is a brief case update. Case numbers continue to drop in the US, California, and San Diego County. There was a small outbreak in Iowa this week. Numbers are low enough generally right now that we can see outbreaks in particular places!

Graph is by me, from data collected from Johns Hopkins University COVID site.
Endcoronavirus County Level Map, February 24th, 2021
Graph is by me, from data collected from Johns Hopkins University COVID site.
Graph is by me, from data collected from Johns Hopkins University COVID site. “Active Confirmed Cases” numbers are calculated based on the assumption that patients confirmed to have SARS-2 virus at least 17 days ago have recovered.
Graph is by me, from data collected from San Diego County Public Health. See also regularly updated slides from SD County.
Graph is by me, from data collected from San Diego County Public Health. See also regularly updated slides from SD County. “Active Confirmed Cases” numbers are calculated based on the assumption that patients confirmed to have SARS-2 virus at least 17 days ago have recovered.

For those of you in the testing field, reported SARS-2 tests dropped below 1 million tests yesterday.

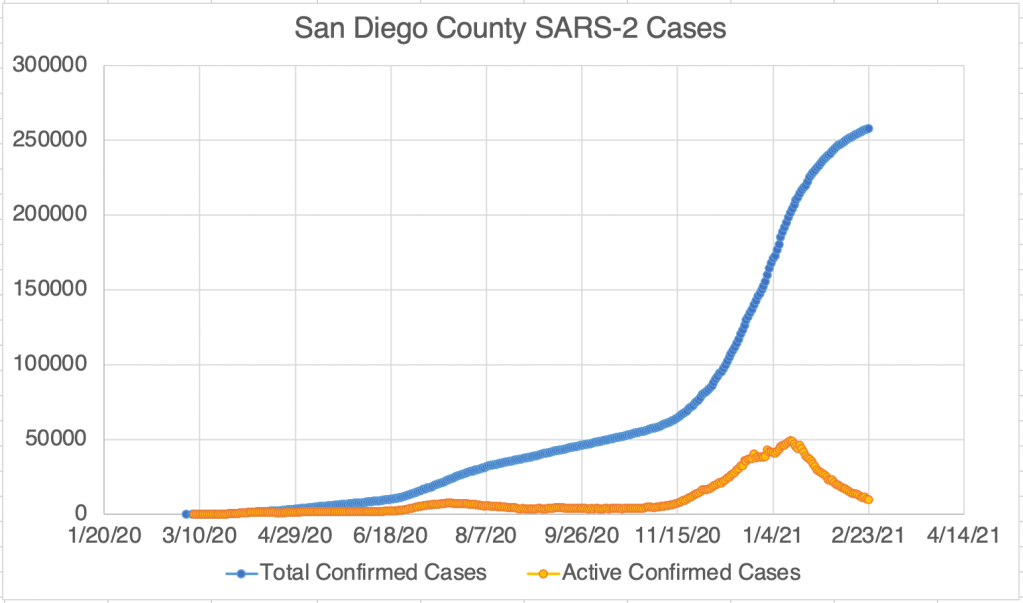
Graph is by me, from data collected from Johns Hopkins University COVID site. This graph shows reported tests. Laboratories are currently required to report both to the ordering physicians and also report positives (without identifying information) to the CDC as well as county and state public health. Some labs have been late reporting to public health, which is why you see some days which have either a very high or very low number of tests.

Don’t fear, but be smart,
Erik

Leave a Reply

Fill in your details below or click an icon to log in:

WordPress.com Logo

You are commenting using your WordPress.com account. Log Out /  Change )

Facebook photo

You are commenting using your Facebook account. Log Out /  Change )

Connecting to %s