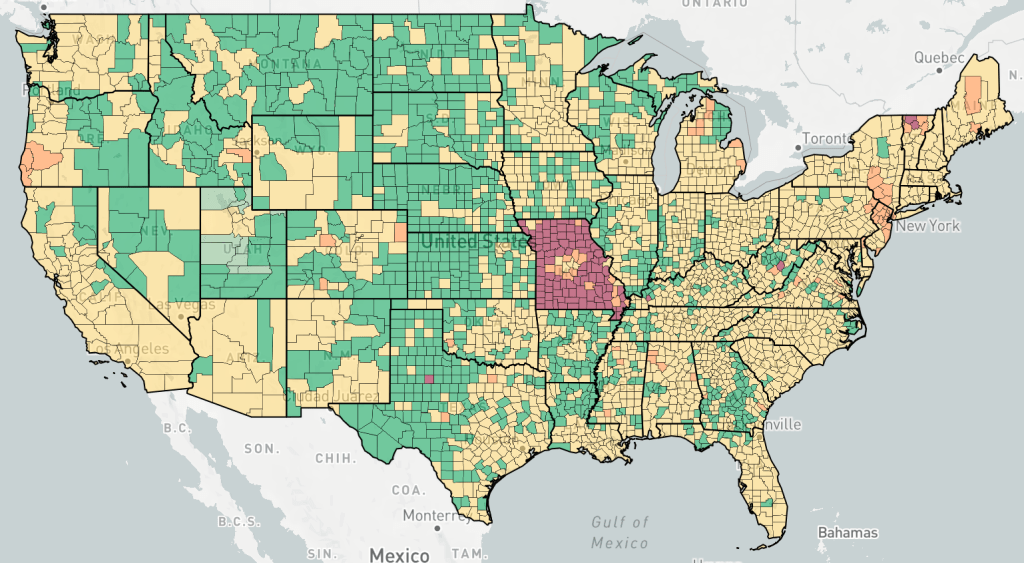
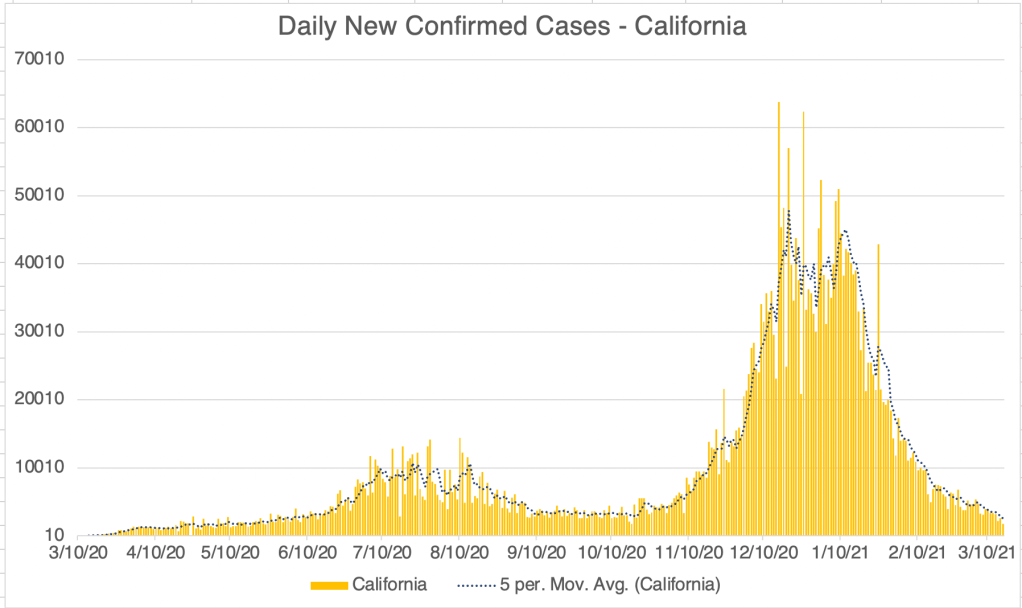
This is a case update. New cases continue to fall for the US, California, and San Diego. There was a spike in cases for the US on March 8th. At the same time, there is a spike in cases in most counties in Missouri. The spike was so consistent across the state, and stops on every nearby state line, that my suspicion is that this represents a reporting problem rather than actual new cases in every county in the state. Sometimes labs or public health departments don’t report on time and allow new case reports to stack up. When they finally report the results, it looks like a big outbreak. I can’t prove that this happened in Missouri, but it’s my suspicion. I couldn’t find any news about this phenomena, and the Missouri state health department shows no spike in cases during this time.


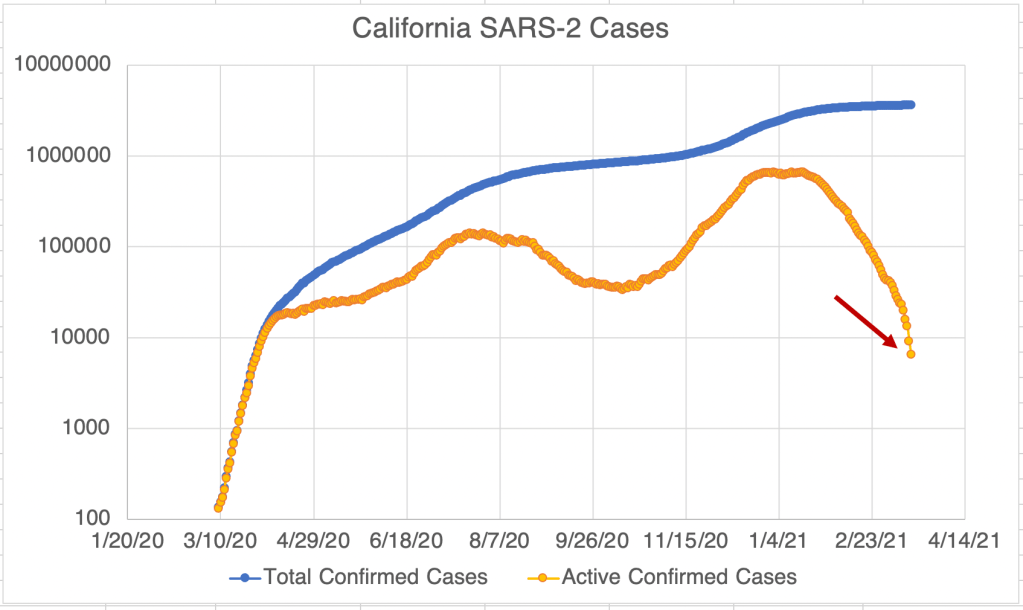
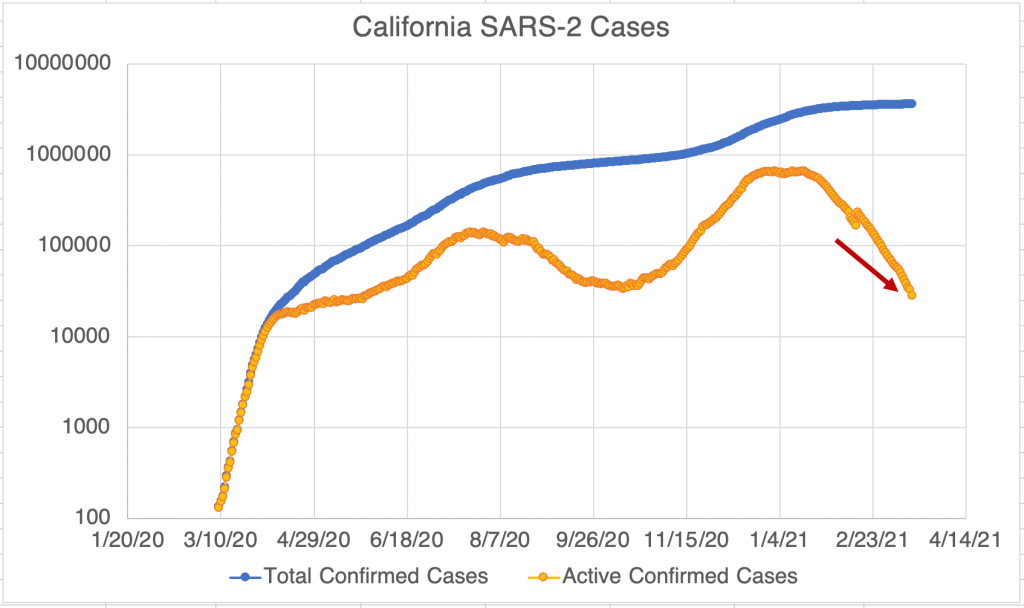
My total case number graph for California assumes that patients recover after 17 days. But today’s number gives a unbelievably low 6500 active cases in California. California doesn’t report recovered cases, so I’ve been using San Diego Counties numbers and extrapolating an estimate for California. Right now, San Diego’s reported recovered numbers suggests a 22 day recovery time instead of 17. If you use 22 days for California, current active cases for California is 28,000. This is why I tell you exactly how I get my information, so if it’s wrong or suspicious, you can decide for yourself if you believe my source.


Still more than in Wave 1? For the last few weeks, I’ve been saying that while our numbers are getting really low, the numbers are still higher than in Wave 1 from last April. A friend pointed out that last Spring we weren’t really testing much, so maybe the cases were higher. That’s an excellent point and absolutely true. In fact I have several friends that were really sick during the Winter of 19/20, some after spending time with friends or family from Asia. So yes, there may have been far more cases last Spring than we know.
Don’t fear, but be smart,
Erik
