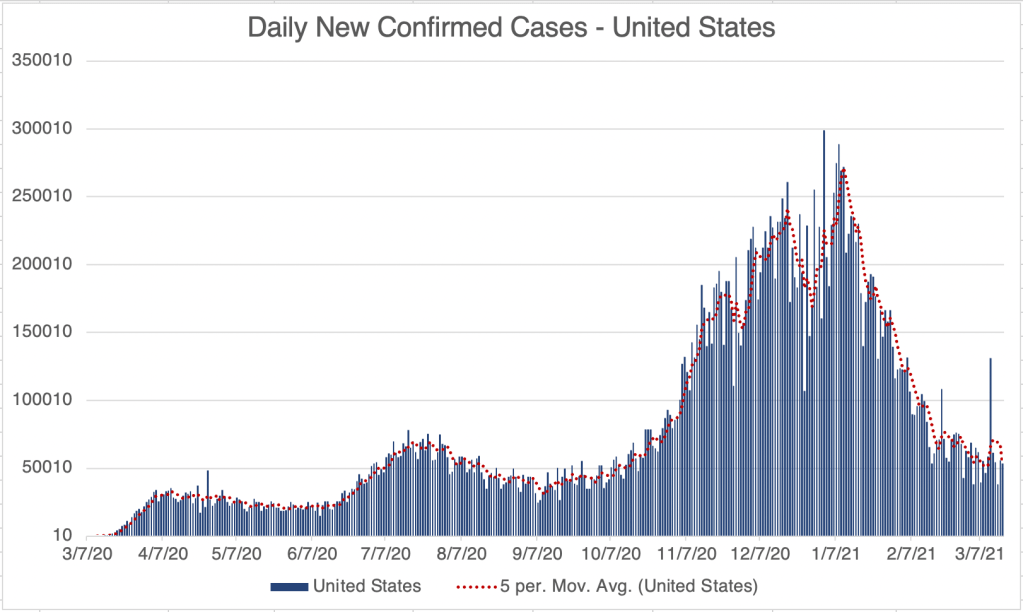
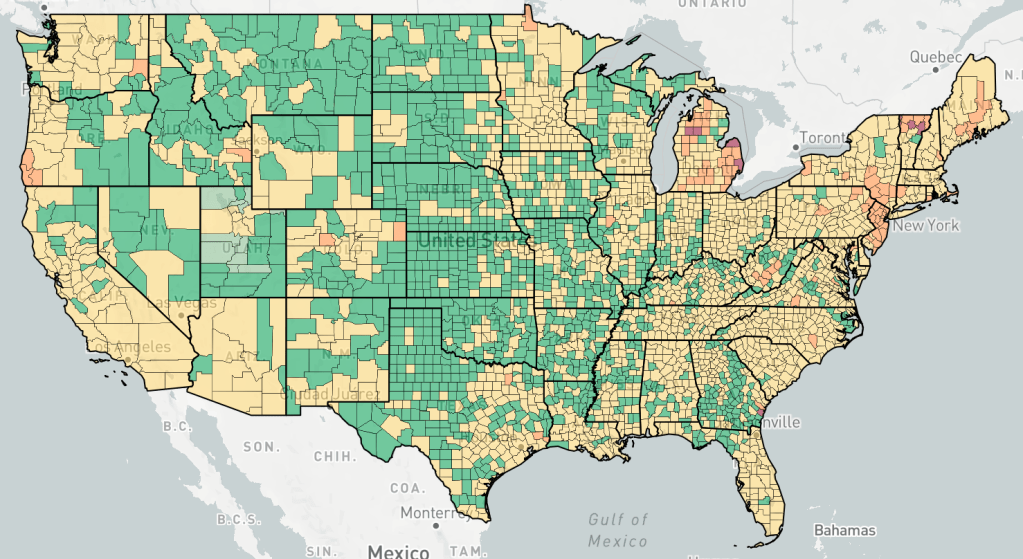
This is a COVID case update. New confirmed case numbers continue to decrease, although slowly. The endcoronavirus county level trend map shows a few small outbreaks in Michigan, but improvement everywhere else.
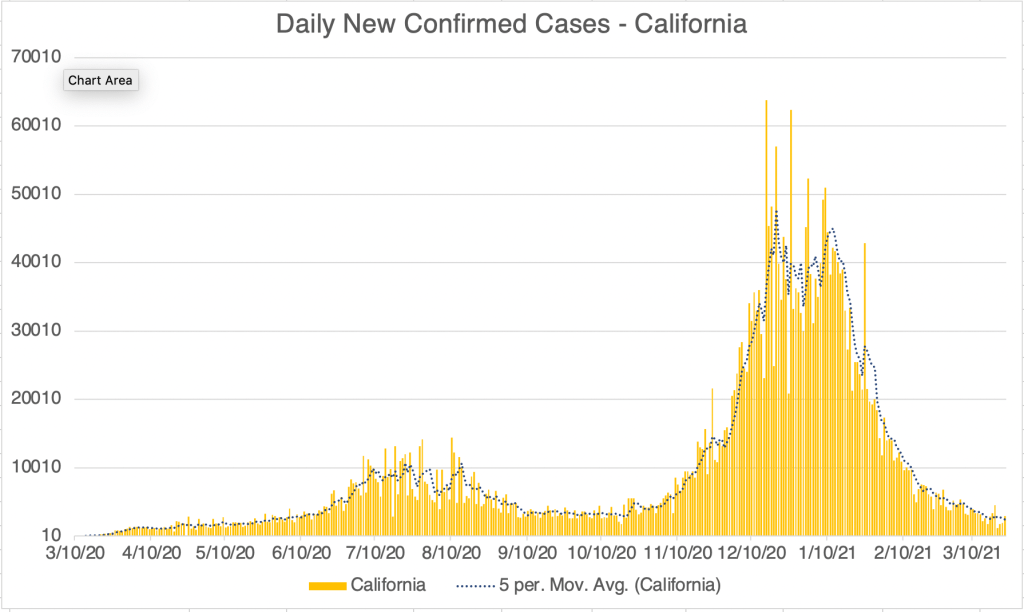
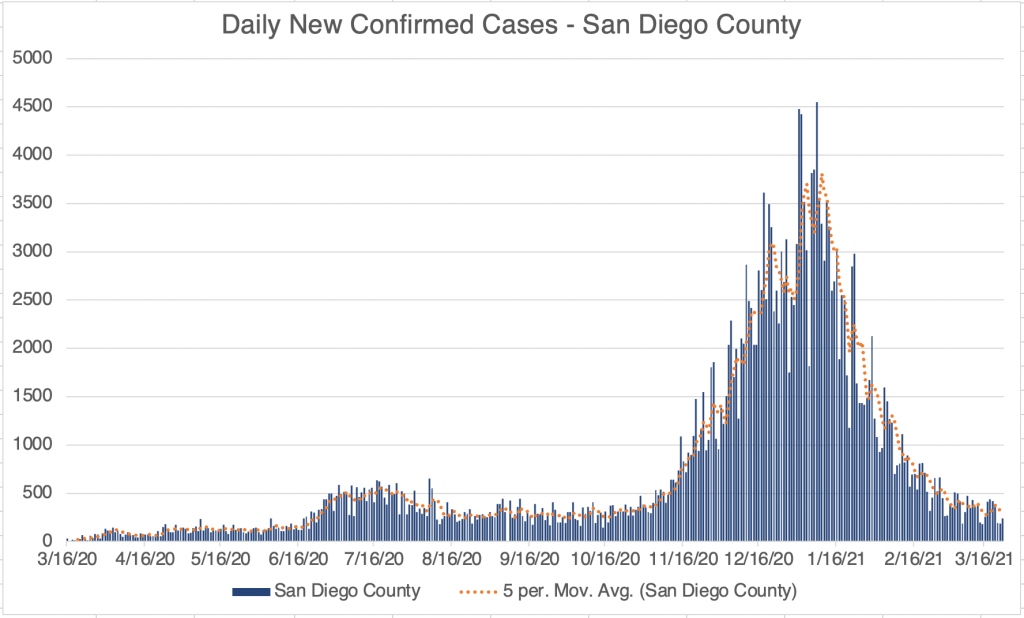
Graph is by me, from data collected from Johns Hopkins University COVID site.Endcoronavirus County Level Map, March 23rd, 2021Graph is by me, from data collected from Johns Hopkins University COVID site.Graph is by me, from data collected from Johns Hopkins University COVID site. “Active Confirmed Cases” numbers have been calculated based on the assumption that patients confirmed to have SARS-2 virus at least 17 days ago have recovered. Recently, however, this would produce an active case number that is too low to make sense in comparison to San Diego. This graph estimates 17 to days to recover in January, but gradually moves to 22 days for mid-March. Is this still useful information?Graph is by me, from data collected from San Diego County Public Health. See also regularly updated slides from SD County.Graph is by me, from data collected from San Diego County Public Health. See also regularly updated slides from SD County. “Active Confirmed Cases” numbers are reported by San Diego County. Because our new active case numbers are getting low, I’ve switched to a logarithmic view. This emphasizes small values and makes them easier to see. Notice that the case number on the left now go up 10 fold with each higher line on the graph.
I’m going to get into the statistical weeds a little bit right now. Read on if you’re interested in that. I often post a graph of new cases along with active cases for California and San Diego County. San Diego actually publishes numbers of recovered patients, but California does not. My estimates for California have been based on the San Diego recovered numbers. San Diego’s recovered numbers have generally matched the new case numbers for 17 days previous, so I’ve been doing the same for California. Now, for whatever reason, San Diego’s recovered numbers have been matching new numbers for 22 days previous, which makes a big difference in “Active Confirmed Cases”. So now I’ve been making a bunch of modifications to my estimates for California numbers, and I’m not sure I feel comfortable showing you such adjusted numbers. So if you have an opinion, let me know in the comments if you want to continue seeing “Active Cases” for California, despite all the guesswork.