Case Update: June 8th, 2021

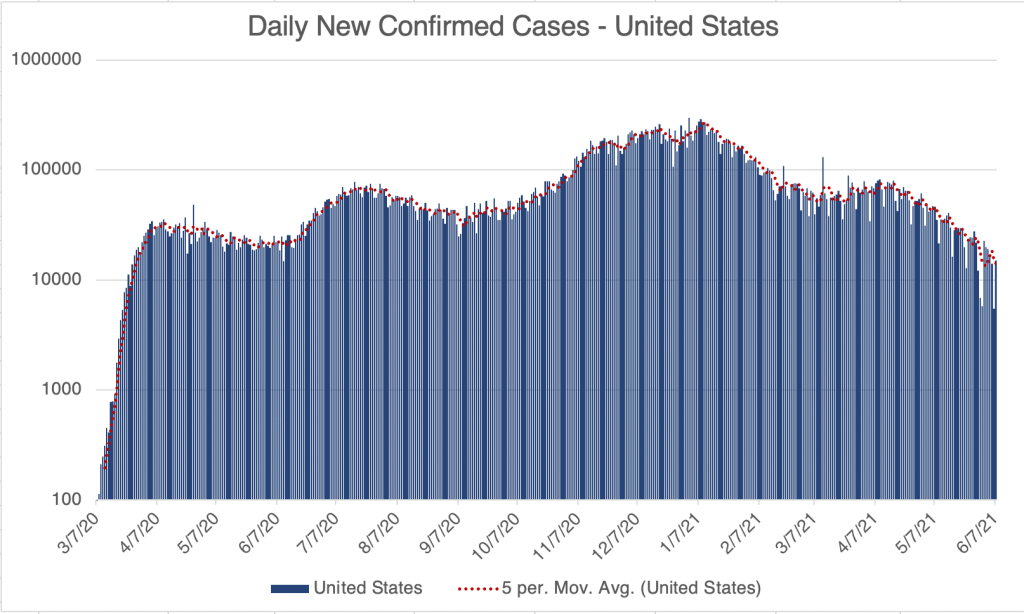
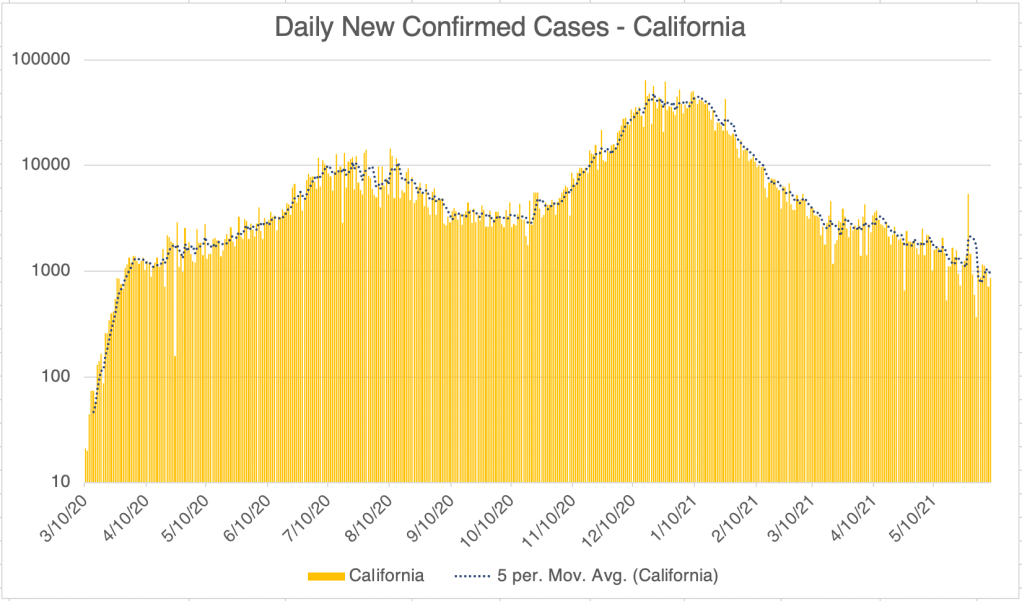
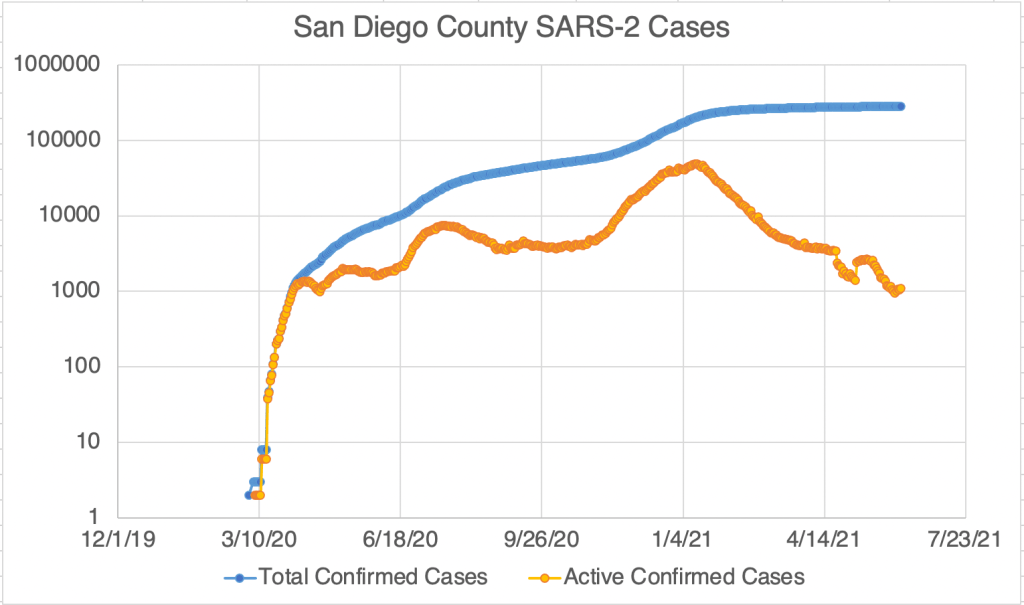
This is a COVID case update. New case numbers for the US, California, and San Diego County continue to steadily drop. In particular, San Diego County has seen fewer than 100 cases in a single day reported 15 times in the last 2 weeks. Also, California has had several days with less than 1,000 cases, and the US has had several days with less than 10,000 cases.

Graph is by me, from data collected from Johns Hopkins University COVID site. Graph is presented in a logarithmic format to emphasize small numbers. Note that each number on the left is 10x higher than the one below it.
Endcoronavirus County Level Map, June 8, 2021
Graph is by me, from data collected from Johns Hopkins University COVID site.
Graph is by me, from data collected from Johns Hopkins University COVID site. Graph is presented in a logarithmic format to emphasize small numbers. Note that each number on the left is 10x higher than the one below it.
Graph is by me, from data collected from San Diego County Public Health. See also regularly updated slides from SD County. Graph is presented in a logarithmic format to emphasize small numbers. Note that each number on the left is 10x higher than the one below it.
San Diego County Media Briefing, June 8th, 2021

Things feel like they’re getting back to normal all over. As I’ve mentioned before, I still haven’t been vaccinated, and am often the only weirdo wearing a mask in an indoor environment. It doesn’t bother me. I know at least 60% of the people I encounter have been vaccinated, and I’m also used to being a weirdo.

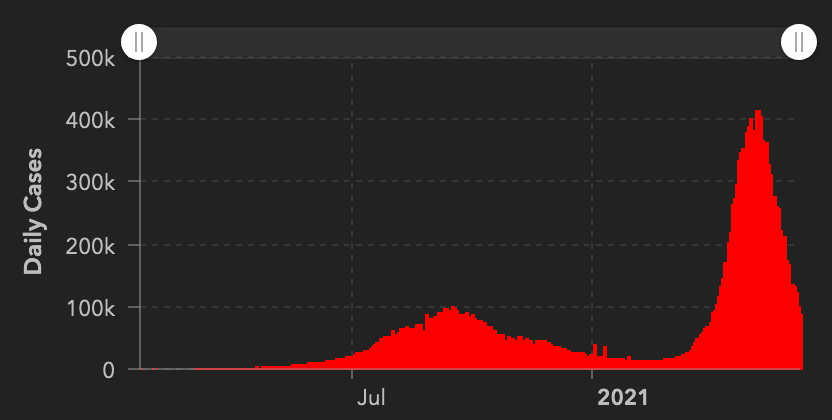
Internationally, case numbers are down, but not everywhere. Cases in India are coming down, but cases in Brazil are persistent. There are still countries in Southeast Asia that have very high new case numbers.

Graph is by me, from data collected from Johns Hopkins University COVID site.
New Cases from India, from Johns Hopkins University COVID site.
New Cases from Brazil, from Johns Hopkins University COVID site.

I will probably have another post later today or tomorrow regarding the Lab Leak hypothesis and all the stuff swirling around that issue right now.

Don’t fear, but be smart!
Erik

Leave a Reply

Fill in your details below or click an icon to log in:

WordPress.com Logo

You are commenting using your WordPress.com account. Log Out /  Change )

Twitter picture

You are commenting using your Twitter account. Log Out /  Change )

Facebook photo

You are commenting using your Facebook account. Log Out /  Change )

Connecting to %s