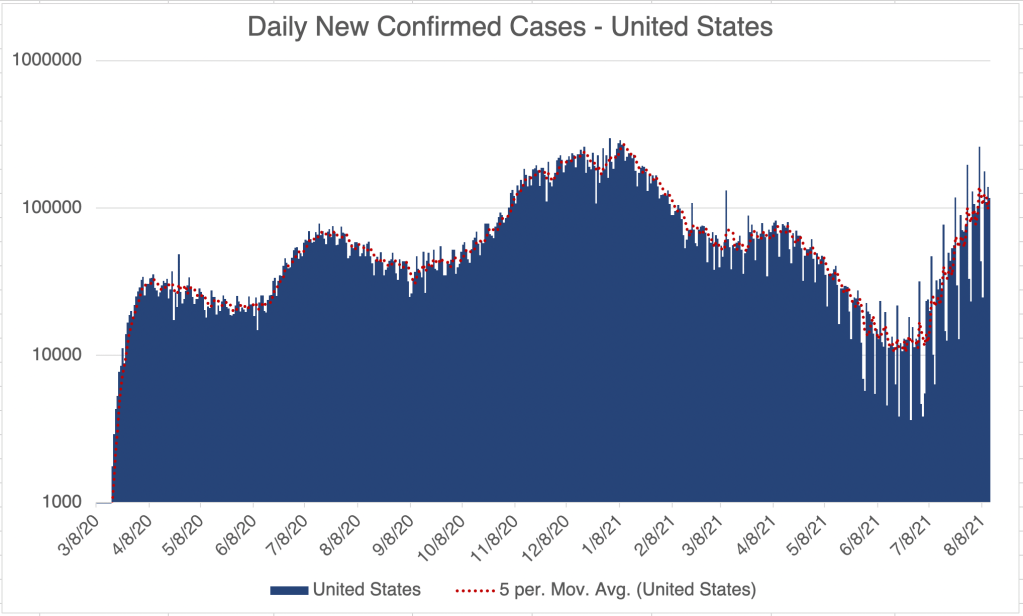
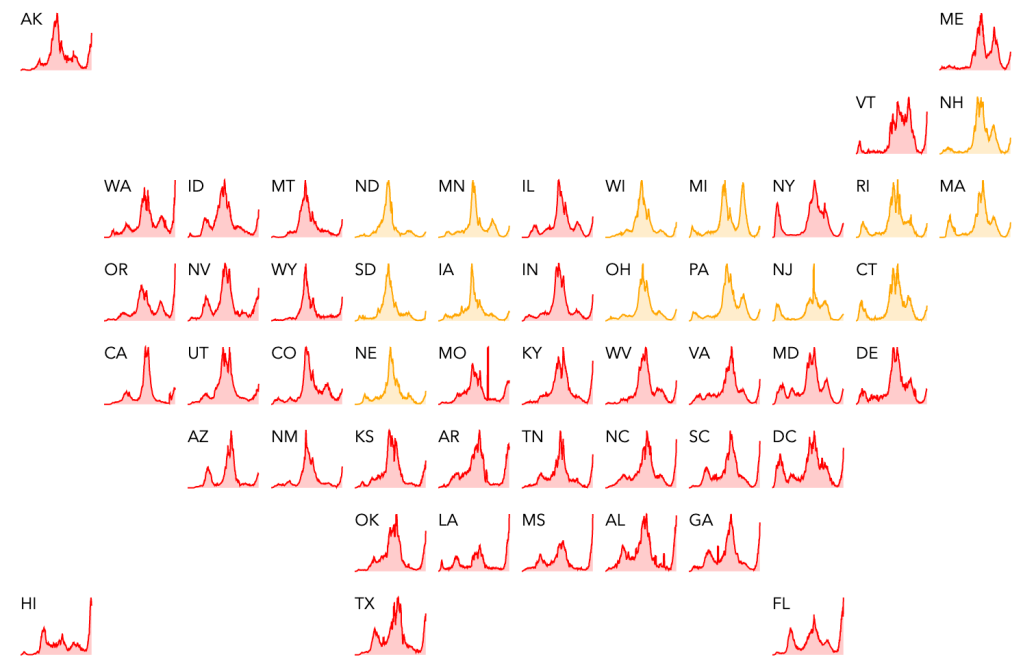
This is a case update. For the US, cases continue to rise, although the rise in cases may be slowing just slightly. New cases are being driven by a few states with rocketing new case numbers, in states in the South, as well as Washington, Oregon, and Hawaii. Only Hawaii is experiencing a decline in cases after a sharp rise.
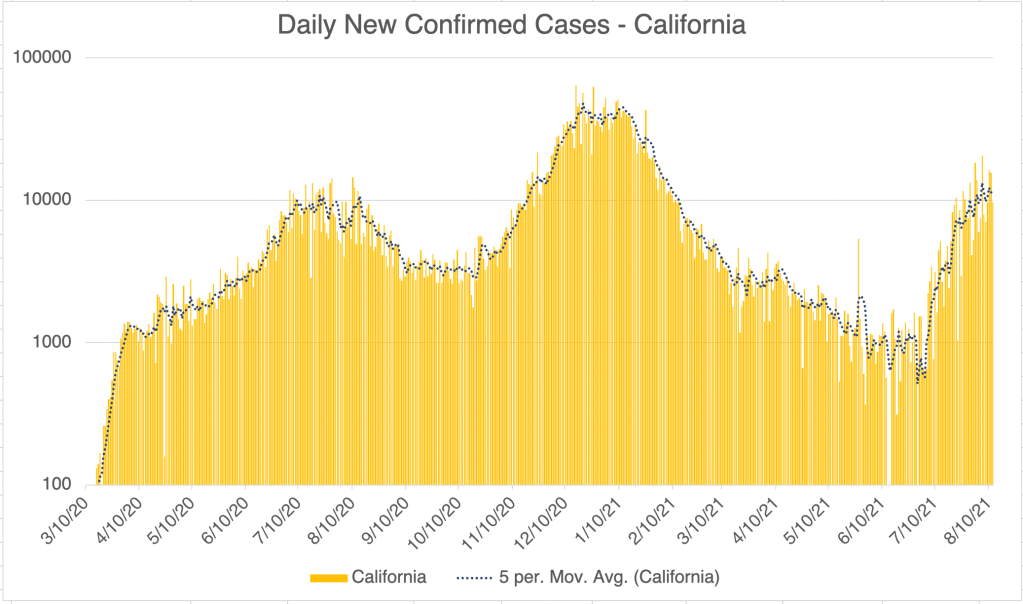
For California and San Diego, new cases are still rising, but more slowly all the time. COVID related deaths are still only creeping up for the US, and still haven’t risen at all for California and San Diego, 6 weeks into the Delta variant peak. At least for now, it continues to appear that the Delta variant is less virulent, at least in the US and some other heavily vaccinated countries.
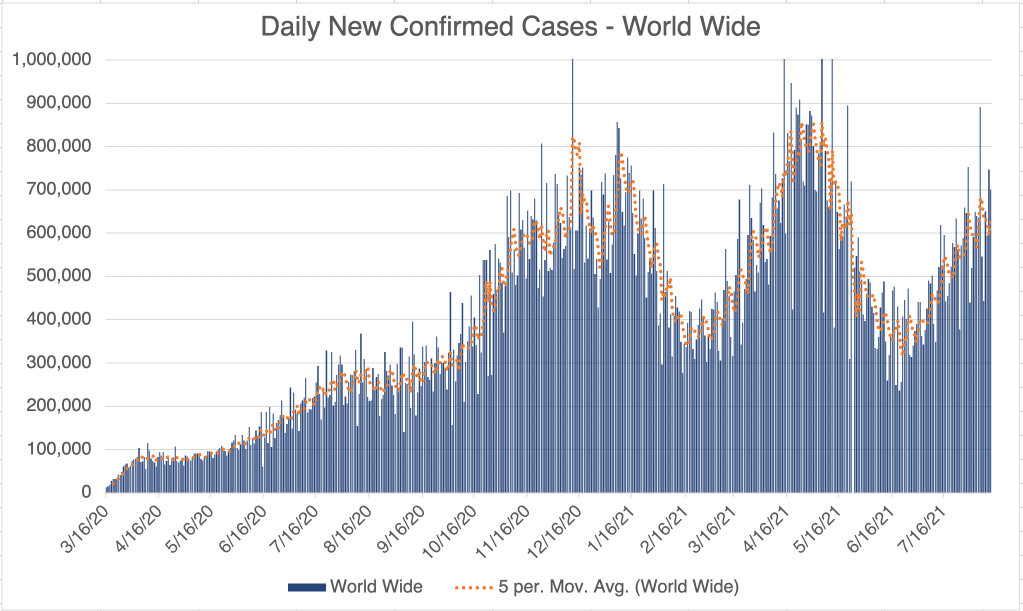
Graph is by me, from data collected from Johns Hopkins University COVID site. Graph is presented in a logarithmic format to emphasize small numbers. Note that each number on the left is 10x higher than the one below it.Graph is by me, from data collected from Johns Hopkins University COVID site. Graph is presented in a logarithmic format to emphasize small numbers. Note that each number on the left is 10x higher than the one below it.Graph is by me, from data collected from San Diego County Public Health. See also regularly updated slides from SD County. Graph is presented in a logarithmic format to emphasize small numbers. Note that each number on the left is 10x higher than the one below it.Graph is by me, from data collected from San Diego County Public Health. See also regularly updated slides from SD County.Graph is by me, from data collected from Johns Hopkins University COVID site. Graph is presented in a linear format.
Incidentally, high infection rates in the South are likely caused by hotter weather causing folks to go inside for air conditioning. Just like last summer.
If the Delta wave isn’t over in the US by October, we are likely to see lots of cases in the North, just like last Fall.