
This is case update. I also have a slightly disappointing and confusing update on Omicron.
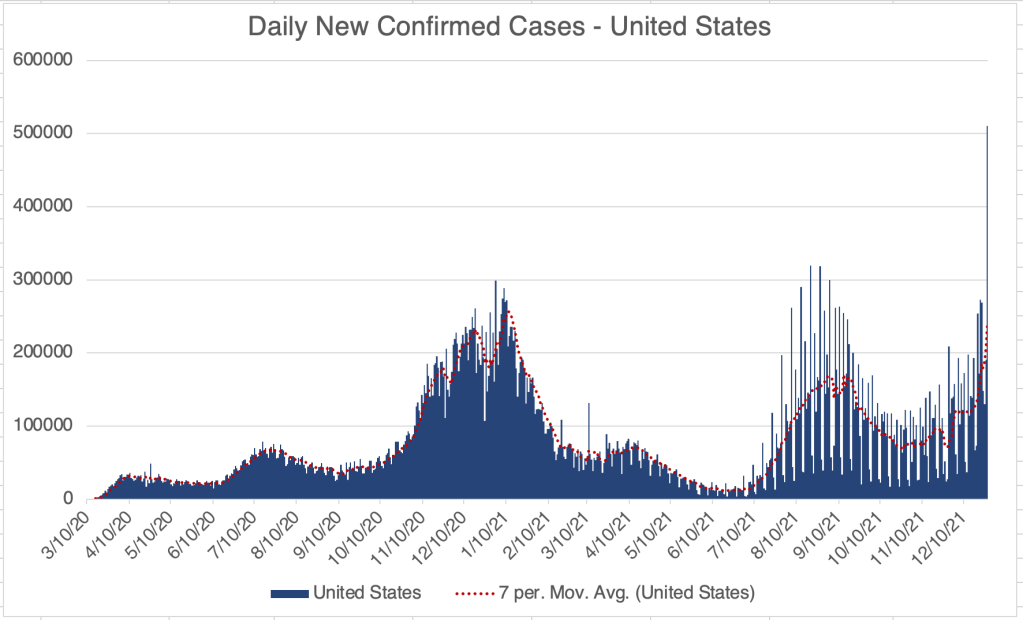
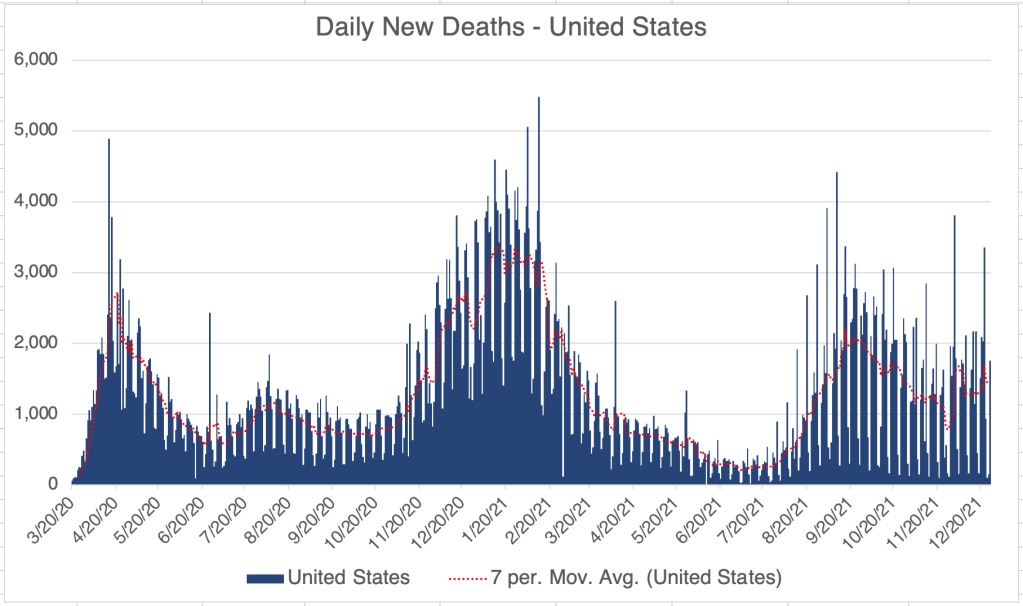
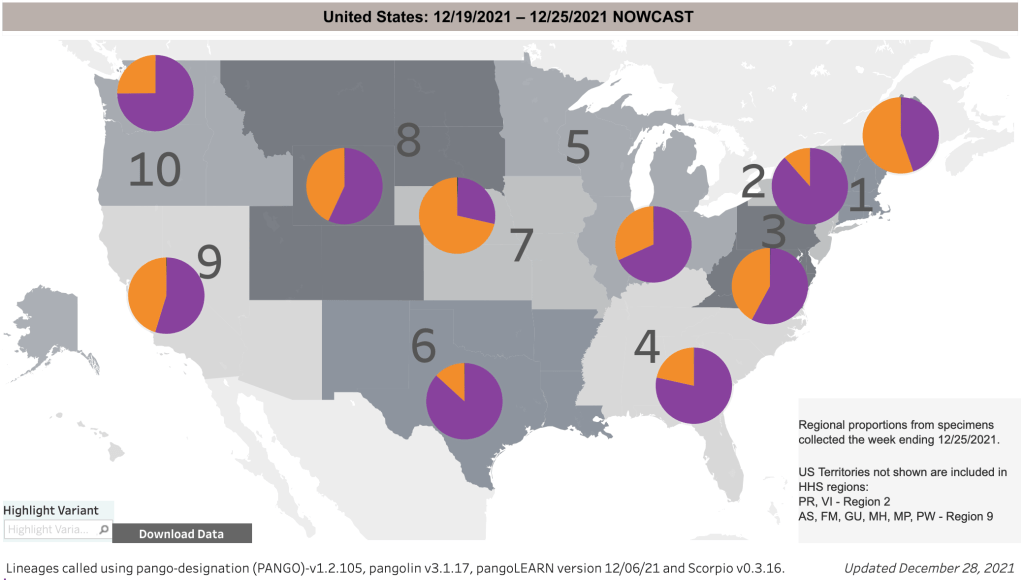
The presence of Omicron is definitely appearing in the numbers for the US. After the Christmas weekend, case reports were unnaturally low because of the holiday, and certainly unnaturally high yesterday. That being said, there were a record number of new daily cases yesterday, mostly due to the Omicron variant (more on that later). Also, as has been seen in many countries, the daily number of deaths is actually starting to trend down. This is great news of course. It appears that the Omicron variant is resulting in a huge number of new cases, but fewer deaths. The incubation time for Omicron is just 2 days, so we will start to see an increase in cases due to holiday gatherings immediately.
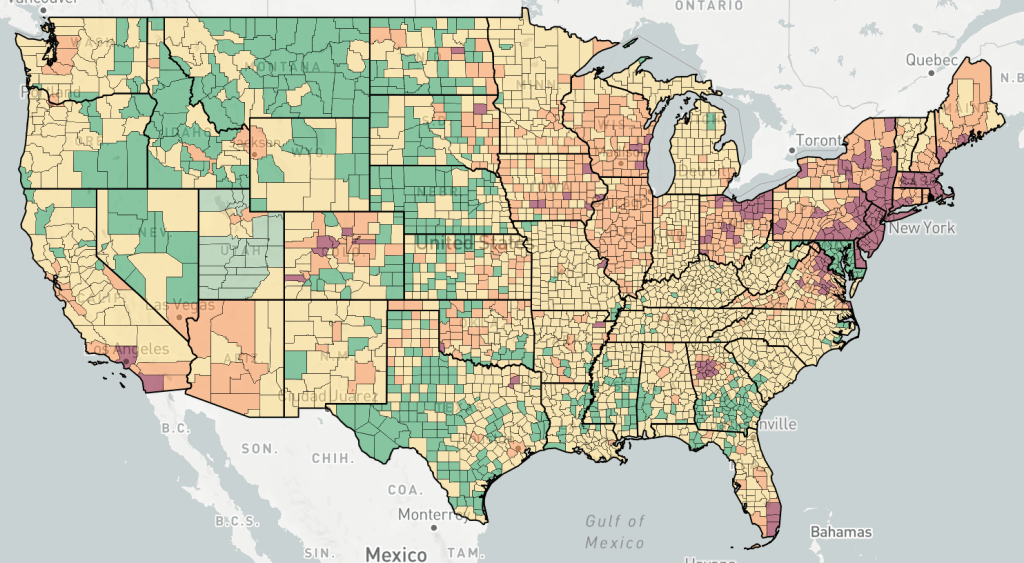
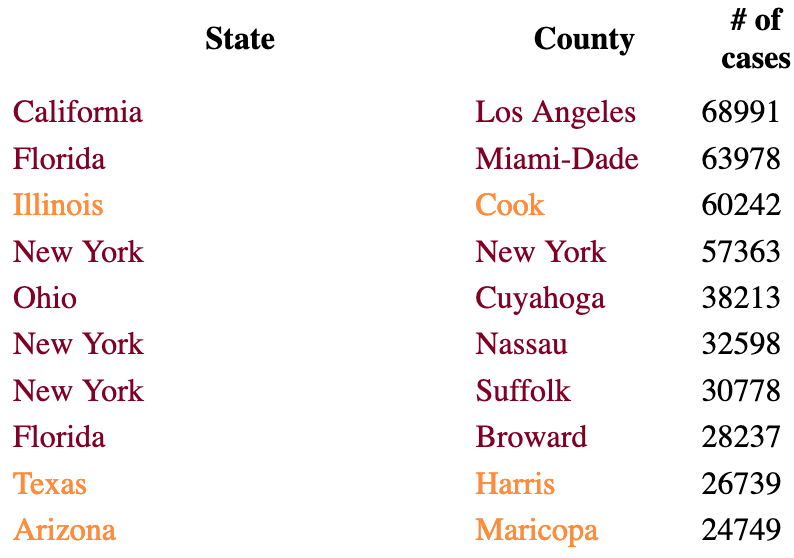
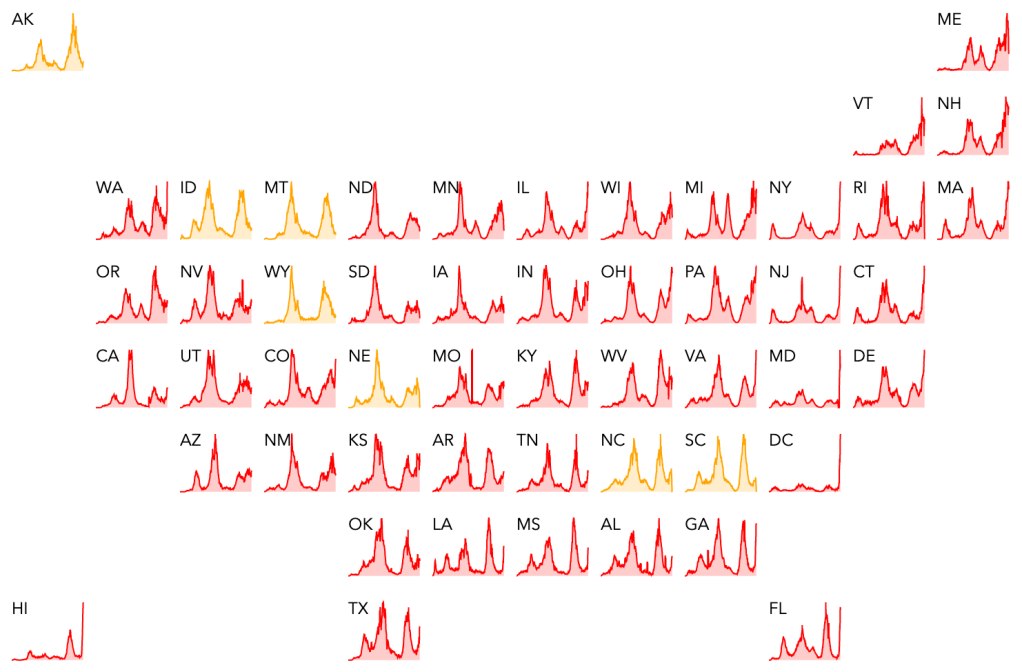
New cases are particularly high in the Northeast. Cases are also increasing in urban areas throughout the country. Hospitalizations are currently trending down.
In California, new cases are trending upward, and deaths are trending slightly downward.


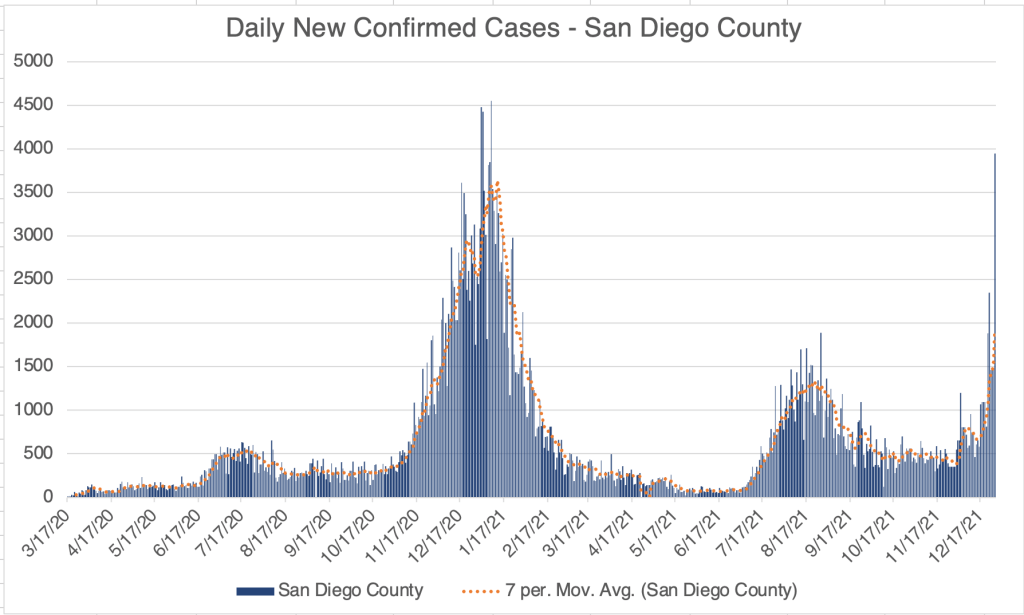
In San Diego County, new cases were extremely high Monday, almost reaching peak numbers from last years Fall/Winter wave.
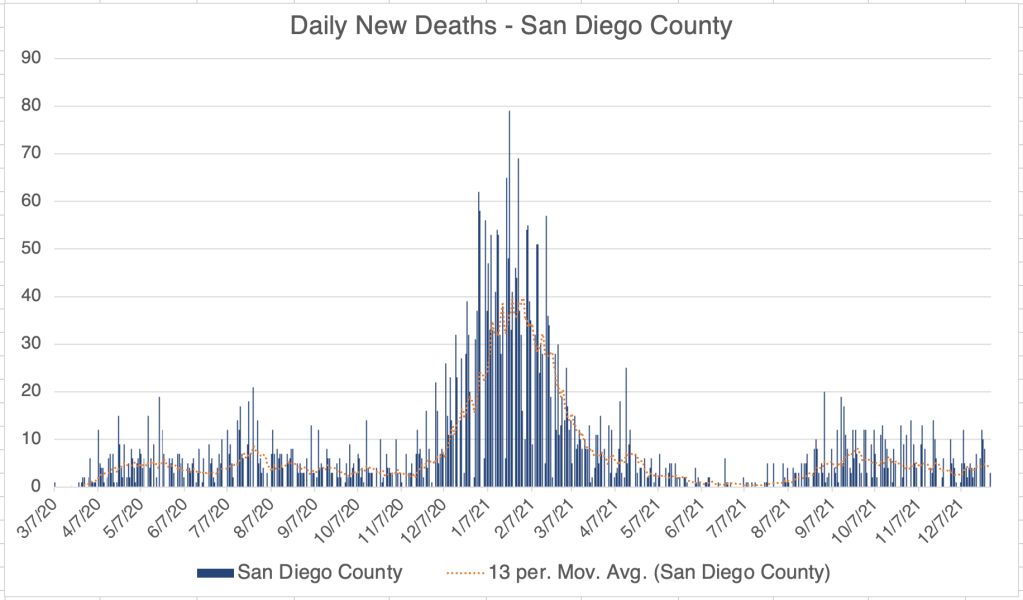

It is great news that deaths are starting to come down, and I certainly hope this trend continues. But I don’t want to overstate the good news. With a huge number of new cases, we will see some increase in deaths, just not nearly as many as we saw with Delta.
Omicron Update: The CDC posted a disappointing piece of data late last night. They republished the bar graph on variant proportions, but numbers were re-accessed for the weeks ending on December 11th and 18th. Now, the percentage of cases due to Omicron for the weeks of the 11th and 18th were just 7% and 22%, instead of the more optimistic 12% and 73%. The percent of Omicron for this week was listed as 58%. According to the new numbers, we are still seeing a rapid growth in Omicron, just not as much.
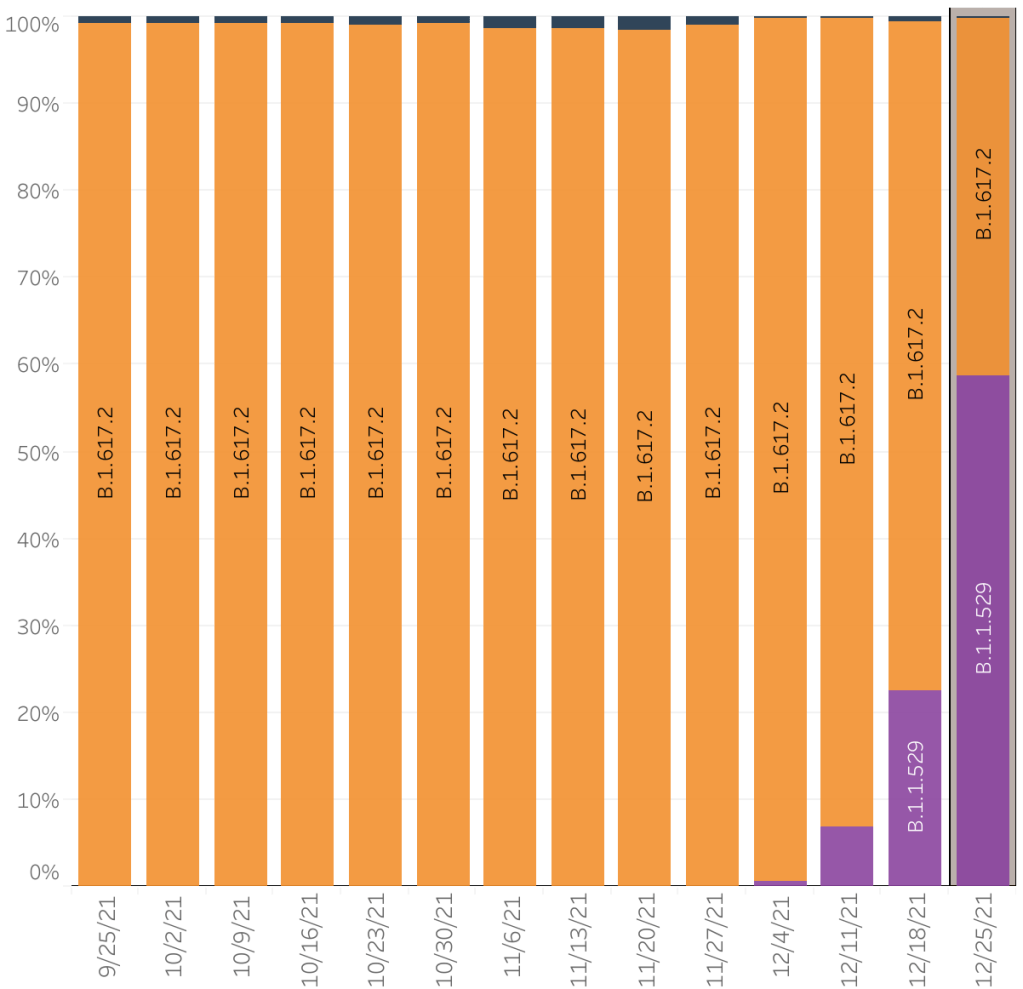
The numbers changed since last week, so the obvious question is “were they wrong then or wrong now?” Data on this chart includes what they call “Nowcast” data for the past 2 weeks. This includes “data” from computer models guessing as to the real percentage. According to this, data from 3 weeks ago (ending on the 11th) would be “real” data, while data from the last 2 weeks includes computer estimates. Whenever you see computer modeling in a set of data, know that computers only know what they are told. If the algorithm doesn’t model well, or bad data is fed into it, you will get inaccurate results. So always take computer modeled data with a big grain of salt. Variant proportions are collected by sequencing a sampling of patient samples, and sequencing is much more labor and cost intensive than just detection, so this data is always a little late. Sampling errors may also effect the results.
Do you have Omicron?: A LOT of people I know had a respiratory illness over the last week. Including us! We both had sore throats over the last week. Usually, this is just allergies, and it may have been, but I was also lightheaded for an hour on Saturday, so I may have had Omicron. I’ve never been lightheaded from allergies. If I did have Omicron, the symptoms were VERY mild, like a mild cold. We both tested negative for COVID by PCR.
A friend of mine, also in the testing field, had Omicron this week, along with her whole family. She is very careful to wear a KN95 mask indoors in public, and everyone in the house was fully vaccinated. She even had loss of taste and smell, rare for Omicron. Most interestingly, she tested negative for several days, only testing positive after several days of symptoms. This presents the disturbing possibility that some of the tests do not detect Omicron, or at least they aren’t as sensitive for Omicron as they were from previous versions. Most of the tests do not detect the Spike protein, which is the most mutated SARS-2 gene, but other genes do have mutations. This likely has lead to the loss of sensitivity. Of course this means that we likely have many more cases of Omicron than we think.
Omicron Symptoms: Omicron causes basic cold-like symptoms, including runny nose, sore throat, fatigue, headache, and cough. It doesn’t not necessarily include a fever, and rarely causes loss of taste and smell, inflammation and blood clotting. Omicron may be mistaken for a cold or simple allergies. Many will not seek treatment for Omicron, so many infections will not enter into the medical system and appear as cases.
Symptoms appear after an incubation period of just 2 days for Omicron, as opposed to the 5-14 for previous versions.
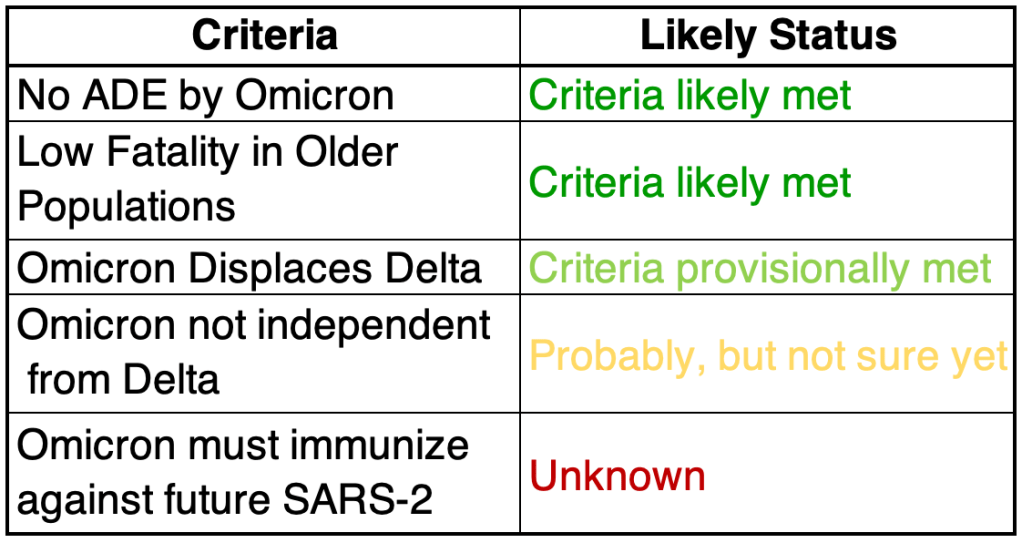
Omicron scorecard: Here’s my “scorecard” for this week. Because of the data revision from the CDC this week, some of these items will be in question, but I’m going to leave the score card unchanged for now, since the case and death numbers are still encouraging. As a reminder, I am not an epidemiologist, I’m a molecular biologist. This is my informed but not expert opinion.
1) Omicron must not use the ADE pathway to produce more severe cases: Looking at the available data so far, while Omicron may preferentially infect those who have been previously infected, cases are still mild, and fatality rates very low. So for now, this criteria is met.
2) Low fatality in older populations: South Africa has a relatively young population, so reports of mild symptoms may not carry over to countries with older populations. The UK data from this week suggests that Omicron deaths will be low, even in older populations. We are seeing a slight drop in deaths already.
3) Displace Delta: Delta has a much higher case fatality rate in the US than Omicron appears to have. For Omicron to end the pandemic, it must displace Delta from the COVID population of strains. With the super high infectiousness of Omicron, it might just do that.
4) Omicron must not circulate independently from Delta: Related to the above, if Omicron is very different from Delta, it may act as a completely different virus. There’s a chance that Omicron may displace Delta on the short term but still allow Delta to persist. Since Omicron is displacing Delta, it looks like this criteria may be met, but we won’t know for sure until we can see if Delta pops back up after the Omicron wave is over.
5) Omicron infection must immunize against future SARS-2: Since Omicron appears to infect those with immunity to Delta, it may be that it is different enough that it will not provide immunity to Delta or other SARS-2 strains. This criteria is not strictly necessary if Omicron completely displaces other SARS-2 strains (see 3 above), but it would be really nice to have some protection against future strains. We won’t know for sure about this one until a new version of COVID arises.
Don’t fear, but be smart,
Erik
