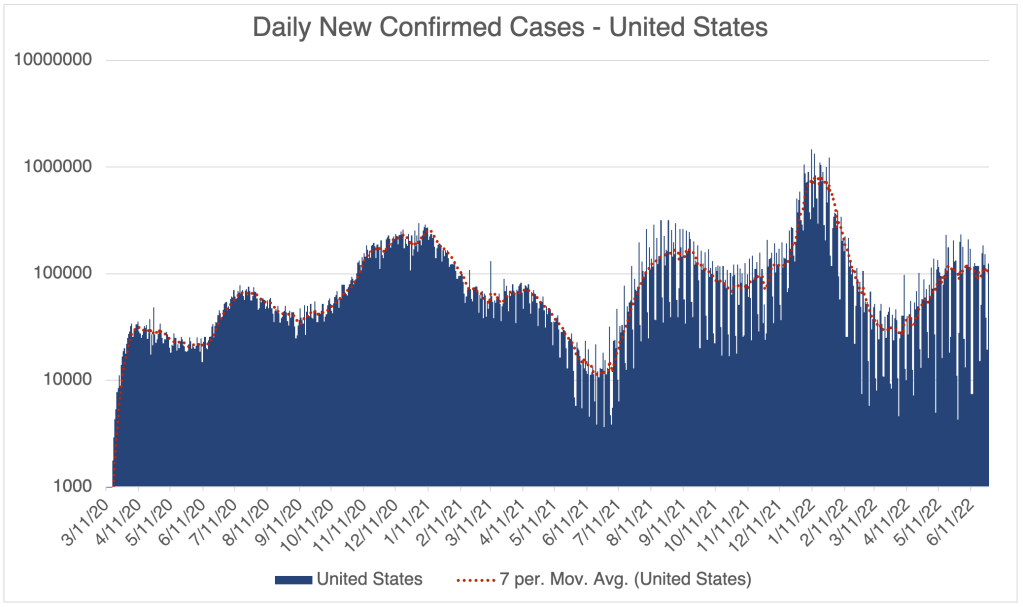
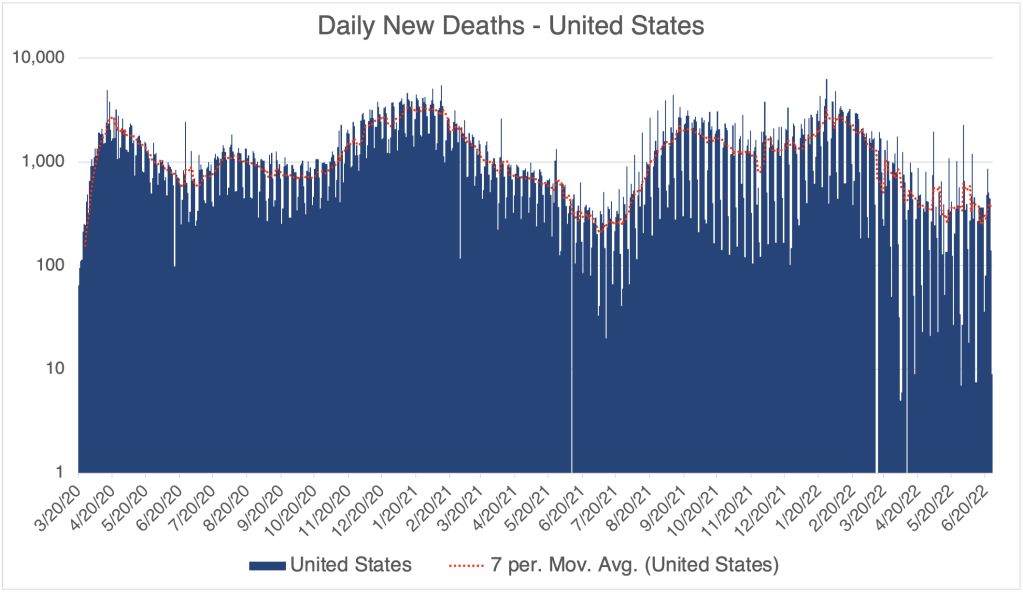
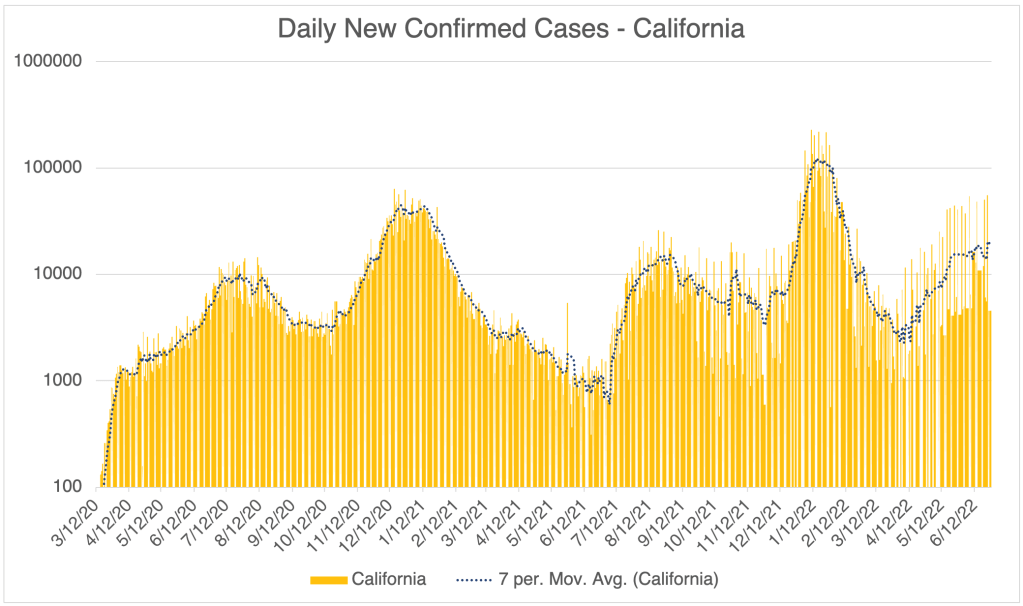
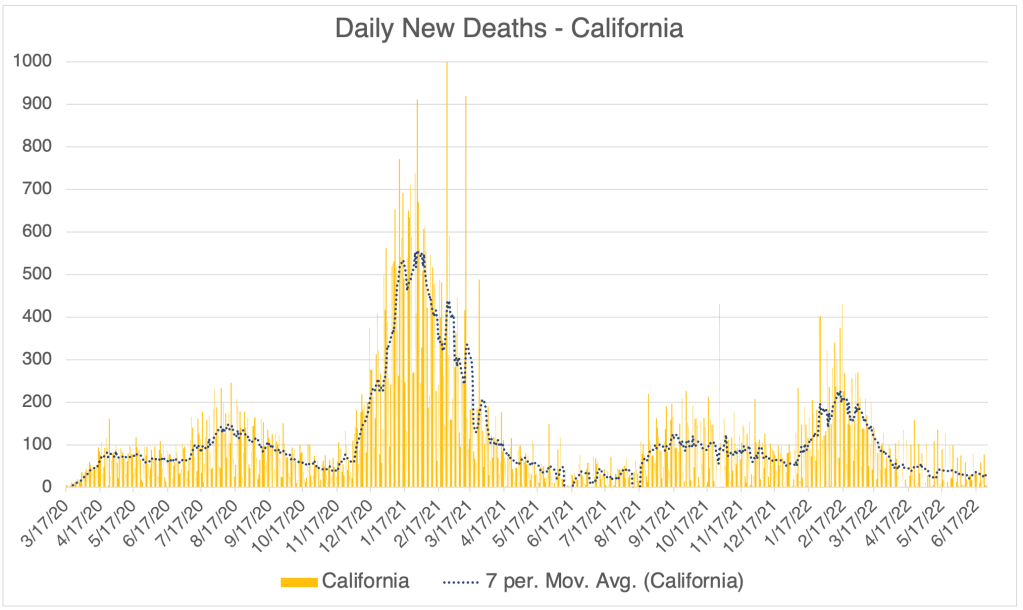
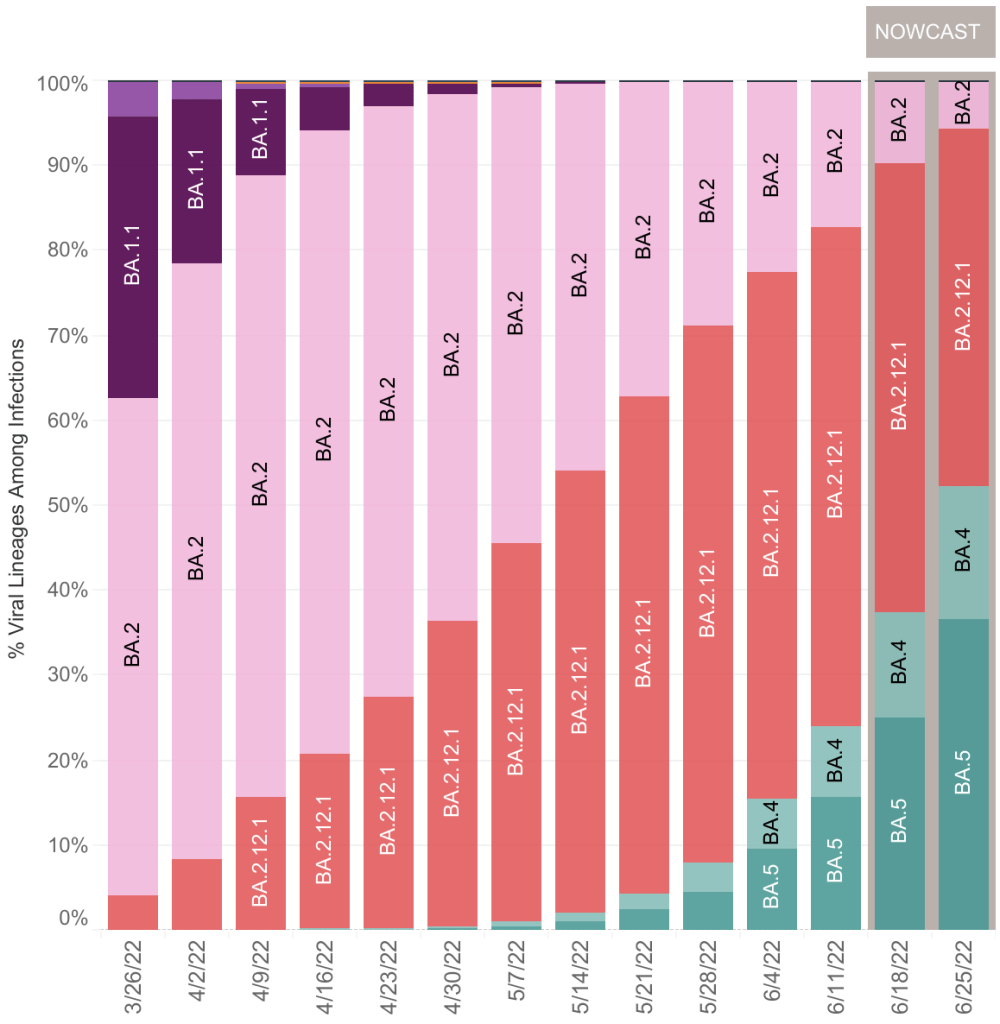
This is a brief COVID update. Cases have been flat in the US, California, and San Diego County, neither rising or falling. This may be partially because of the introduction of 2 new variants, BA.4 and BA.5. These new variants are both of the Omicron vintage. The good news is that deaths have not risen for many weeks even after cases rose due to the BA.2 variants.
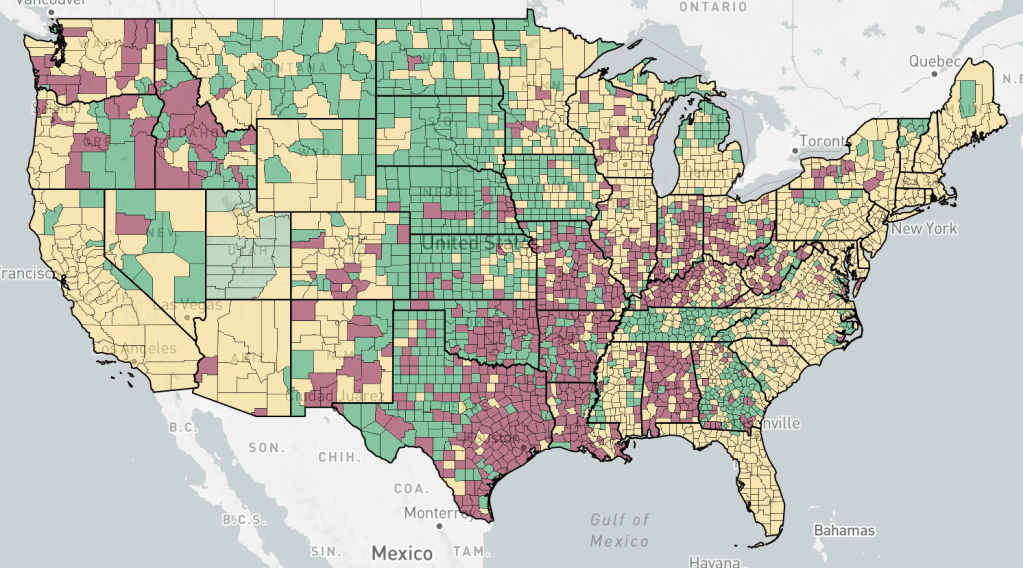
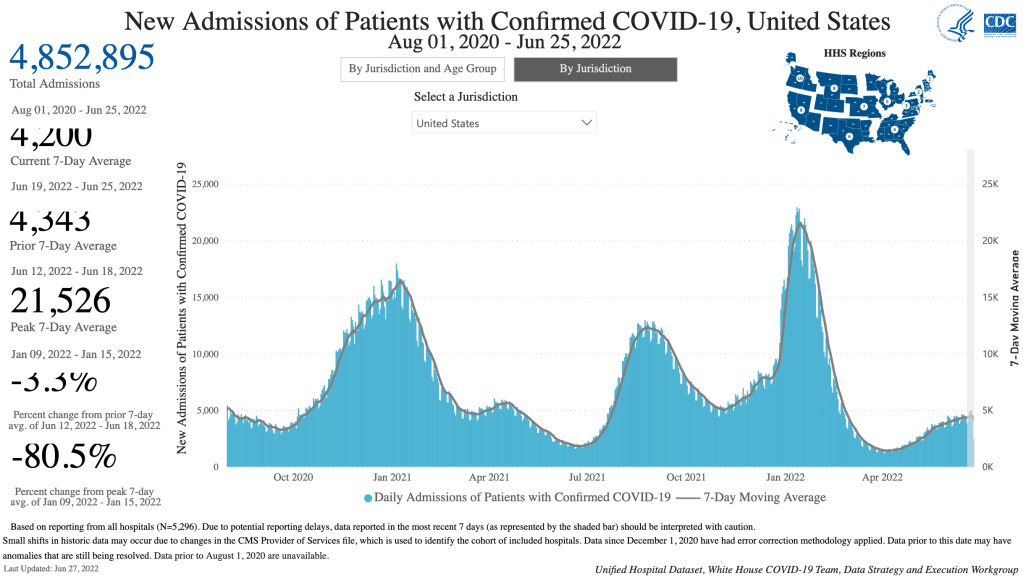
Graph is by me, from data collected from Johns Hopkins University COVID site. Graph is presented in a logarithmic format to emphasize small numbers. Note that each number on the left is 10x higher than the one below it.Graph is by me, from data collected from Johns Hopkins University COVID site. Graph is presented in a logarithmic format to emphasize small numbers. Note that each number on the left is 10x higher than the one below it.Endcoronavirus County Level Map, June 28th, 2022Hospitalizations, from the CDC website.Graph is by me, from data collected from Johns Hopkins University COVID site. Graph is presented in a logarithmic format to emphasize small numbers. Note that each number on the left is 10x higher than the one below it.Graph is by me, from data collected from Johns Hopkins University COVID site. Graph is presented in a linear format.Graph is by me, from data collected from San Diego County Public Health. Graph is presented in a logarithmic format to emphasize small numbers. San Diego County now only releases information Monday and Thursday each week. Data points shown are extrapolated using this information.Graph is by me, from data collected from San Diego County Public Health. Graph is presented in a linear format. San Diego County now only releases information Monday and Thursday each week. Data points shown are extrapolated using this information.Graph is by me, from data collected from Johns Hopkins University COVID site. Graph is presented in a linear format.
My guess is that BA.4 and BA.5 will continue to drive new cases for a few more weeks before we start seeing cases come down. It appears that the fatality rate for these new variants is also very low when compared to other COVID variants.
The contribution BA.4 and BA.5 variants in the US is growing, as they new represent approximately 50% of the total SARS-2 viruses in the country.