It’s been more than 2 months since my last post. Today, I’ll give a little update on new cases, plus a collection of brief but interesting stories. Michael Shellenberger claims to have interviewed 3 “patient zeros” from the Wuhan Institute of Virology. Then I’ll discuss a study from the Cleveland Clinic on booster effectiveness, a report from John Campbell on adverse events from vaccines, and a story about excess deaths pointing to vaccine injury, supported by another video from John Campbell.
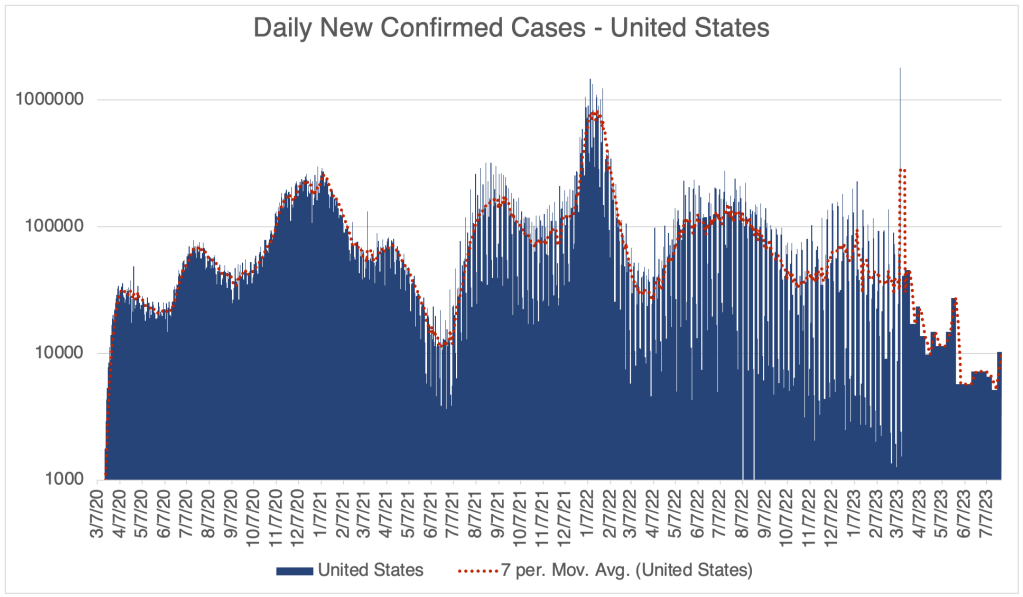
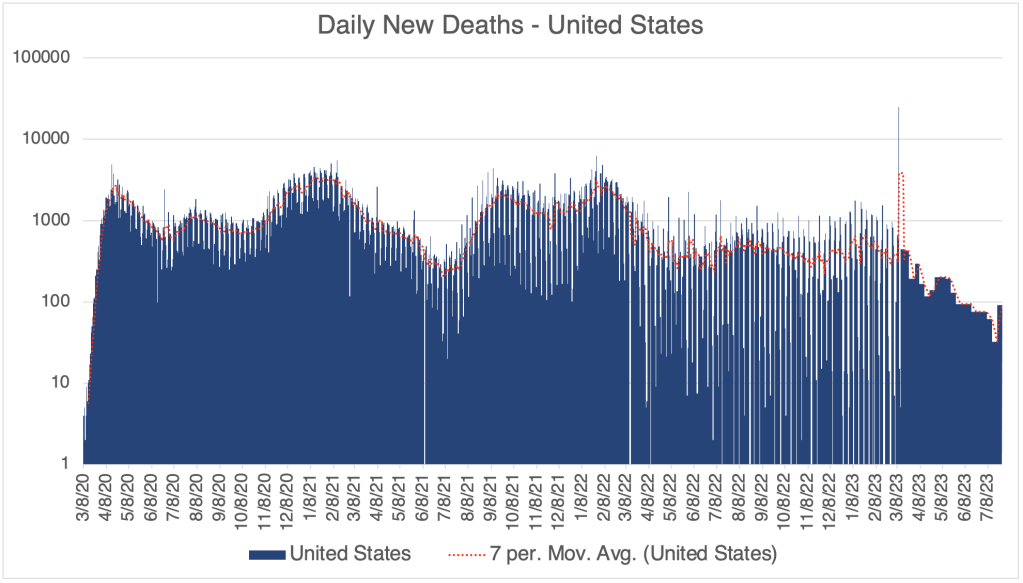
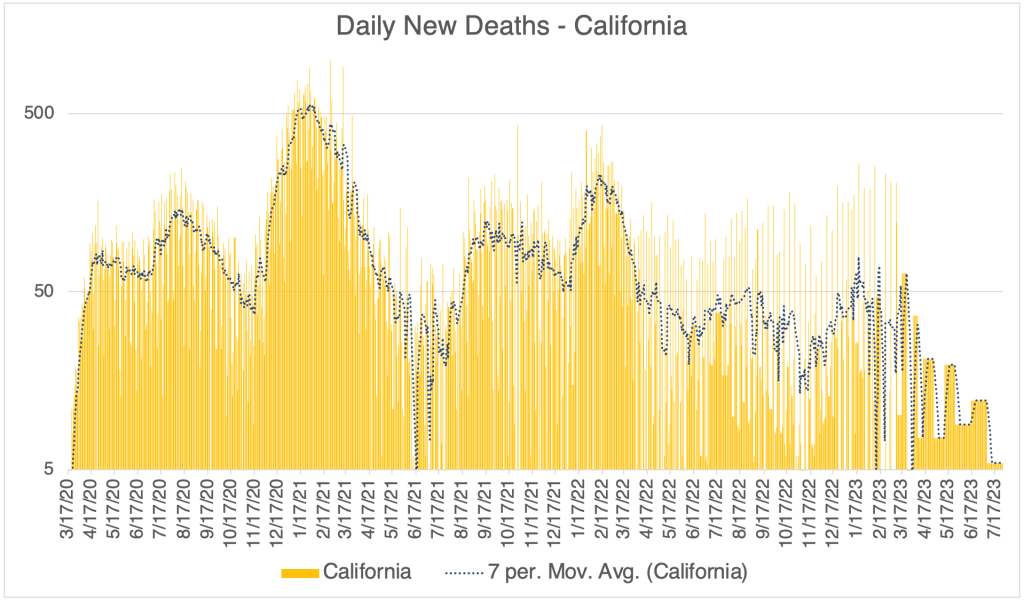
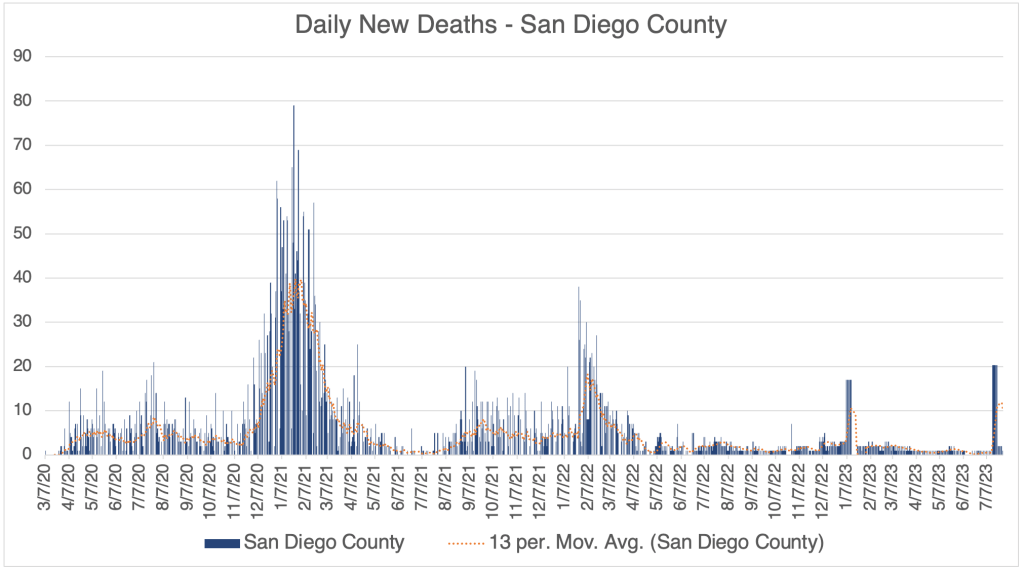
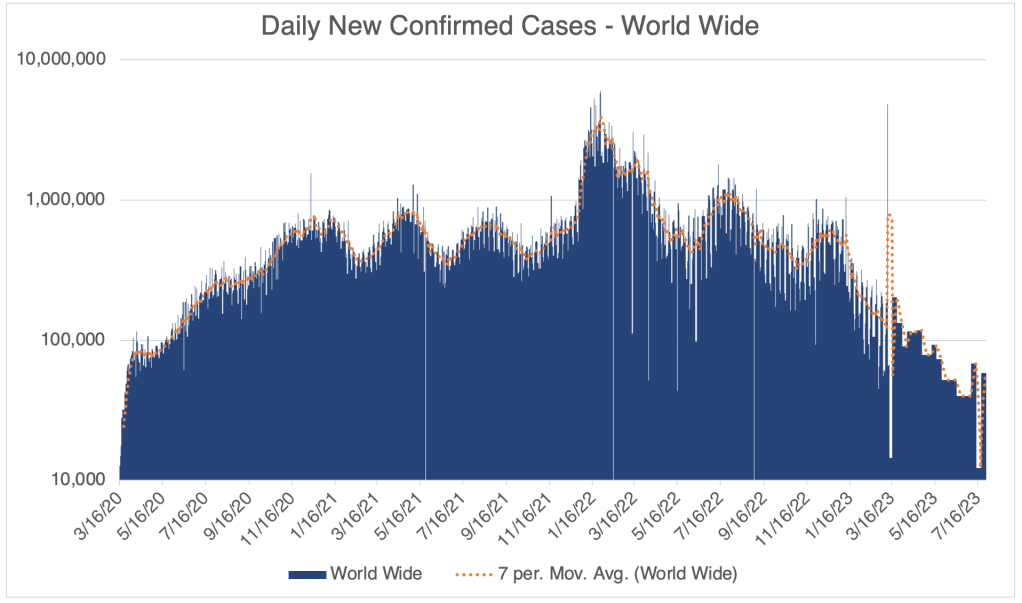
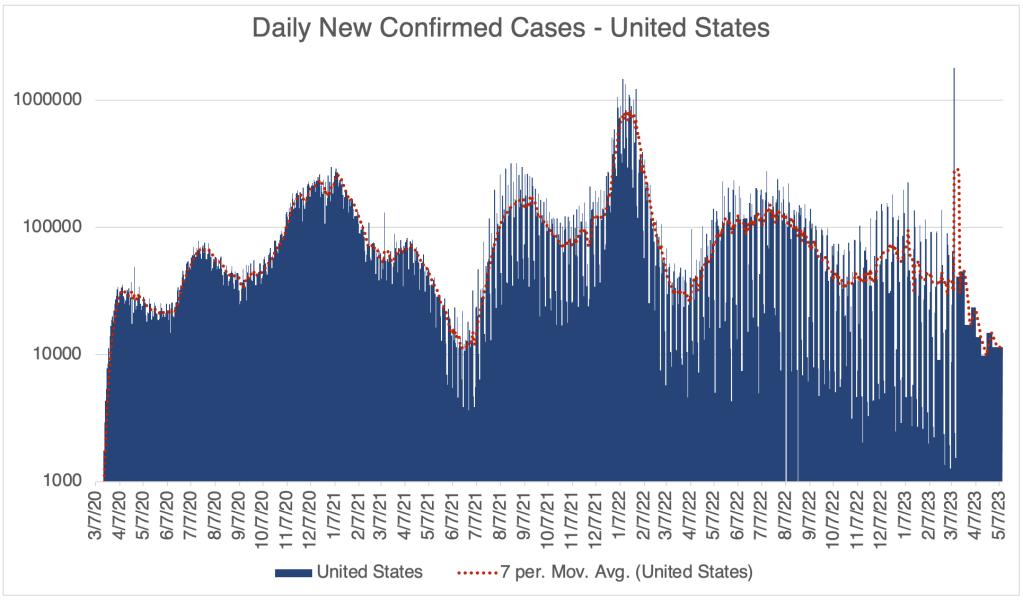
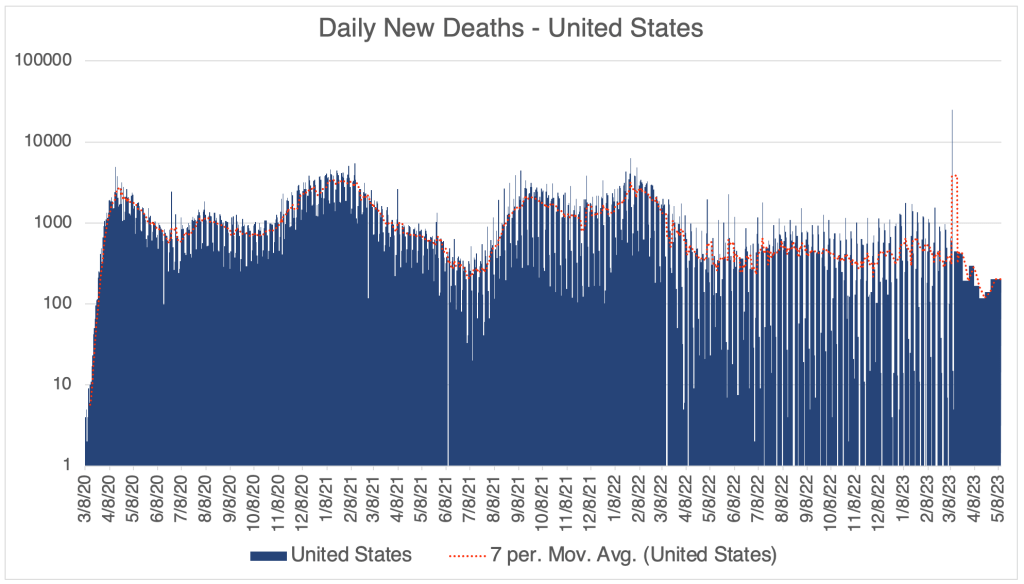
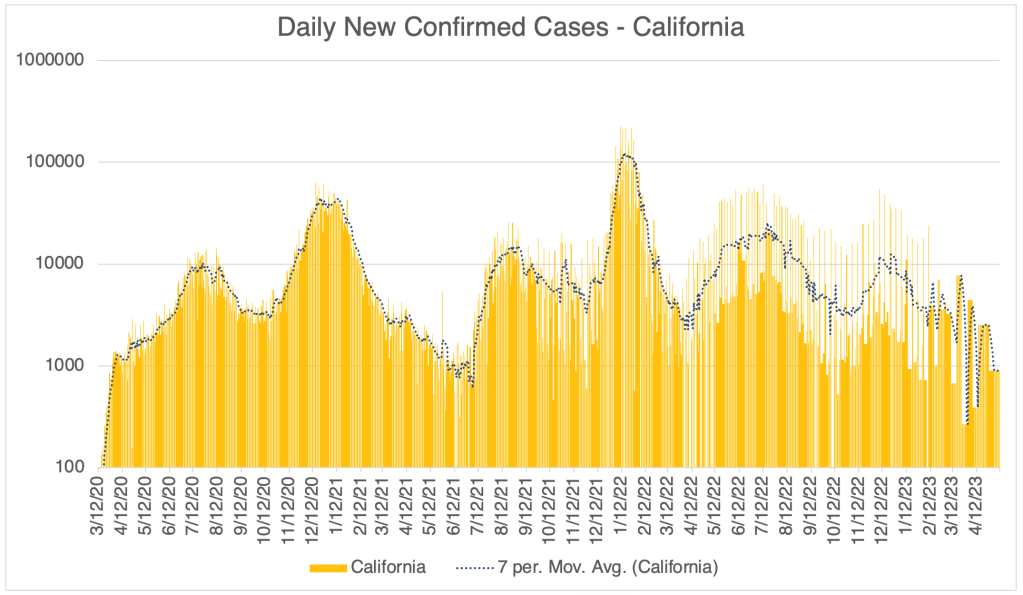
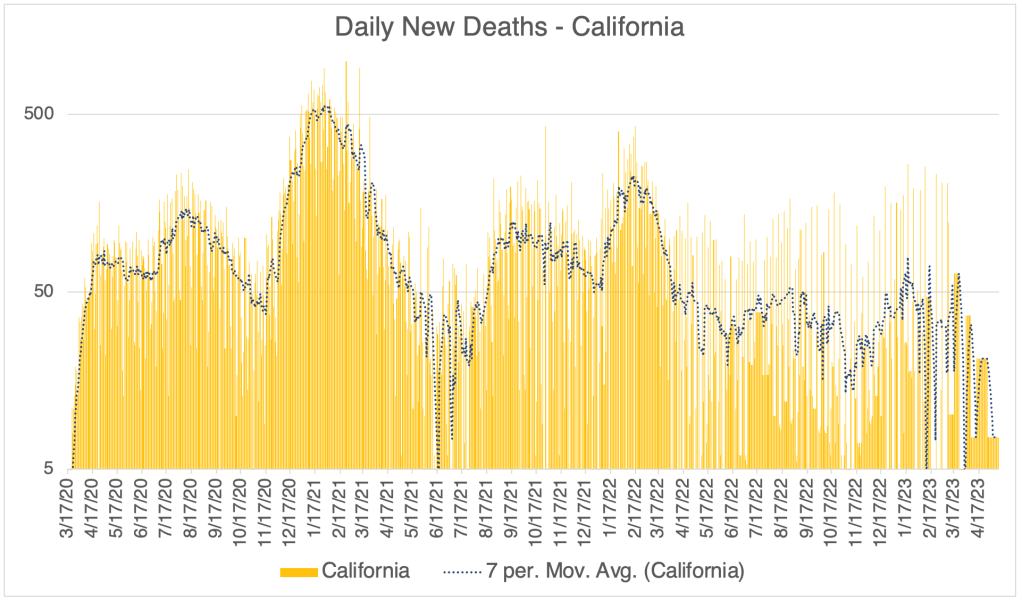
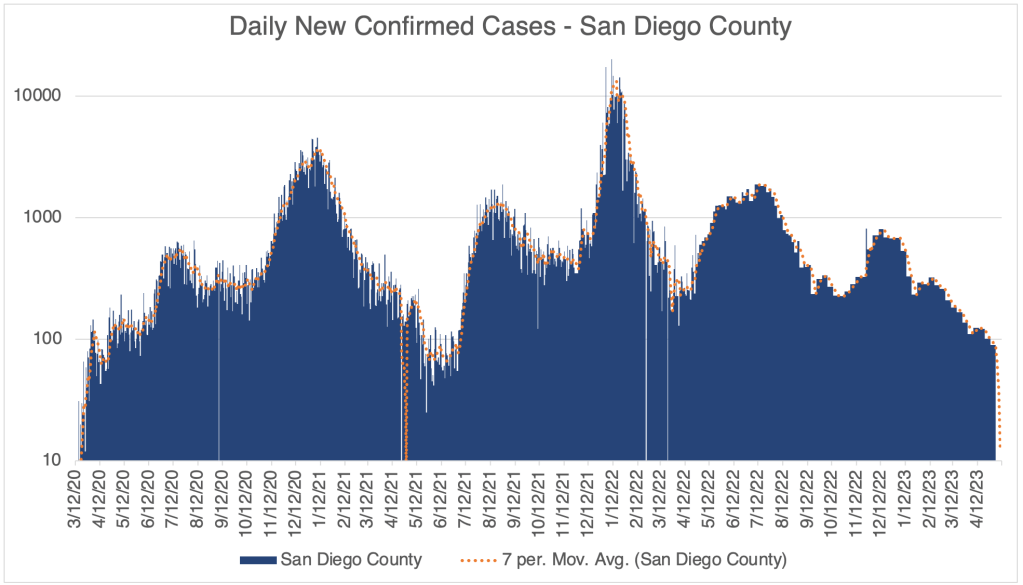
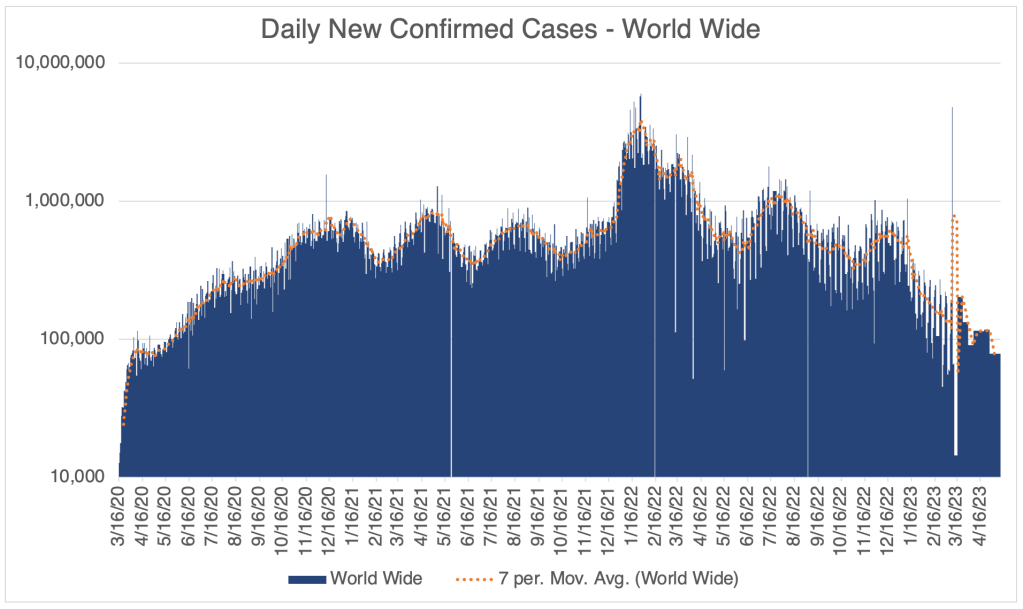
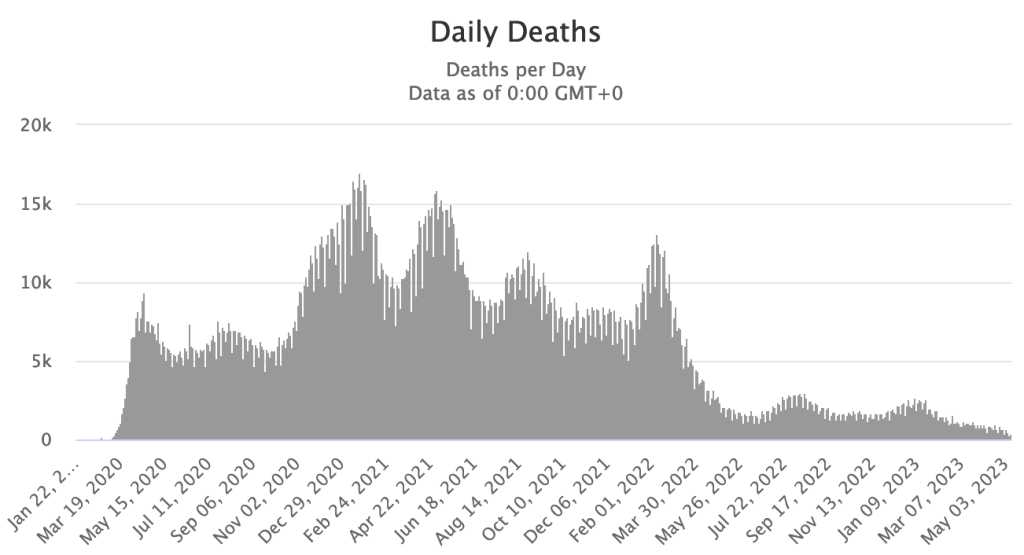
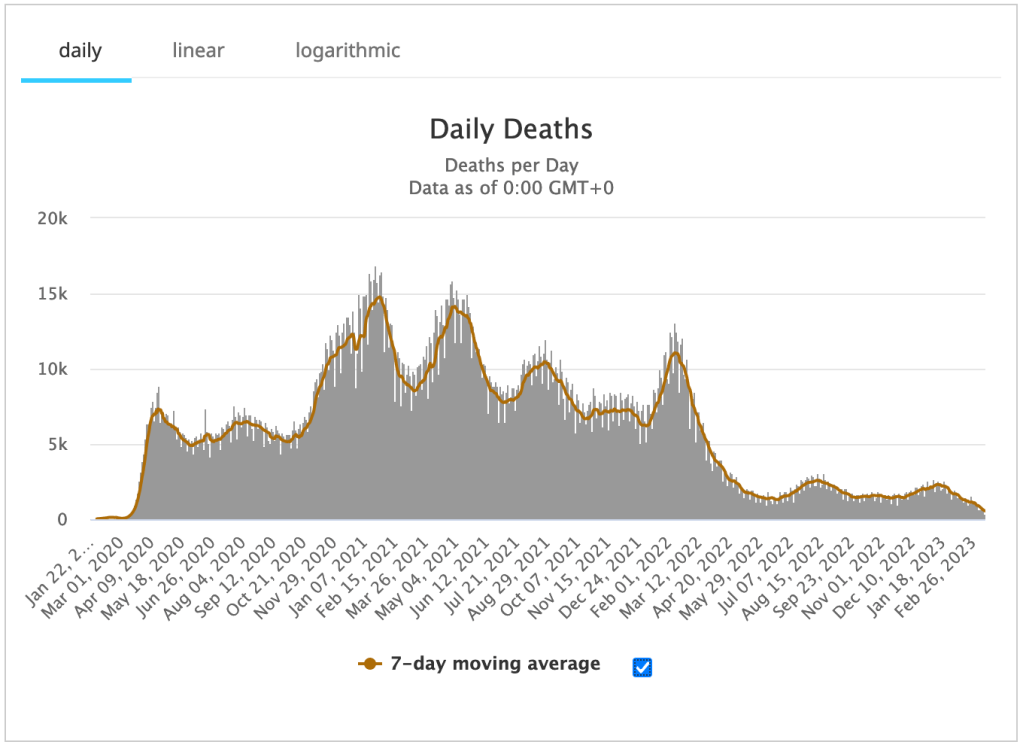
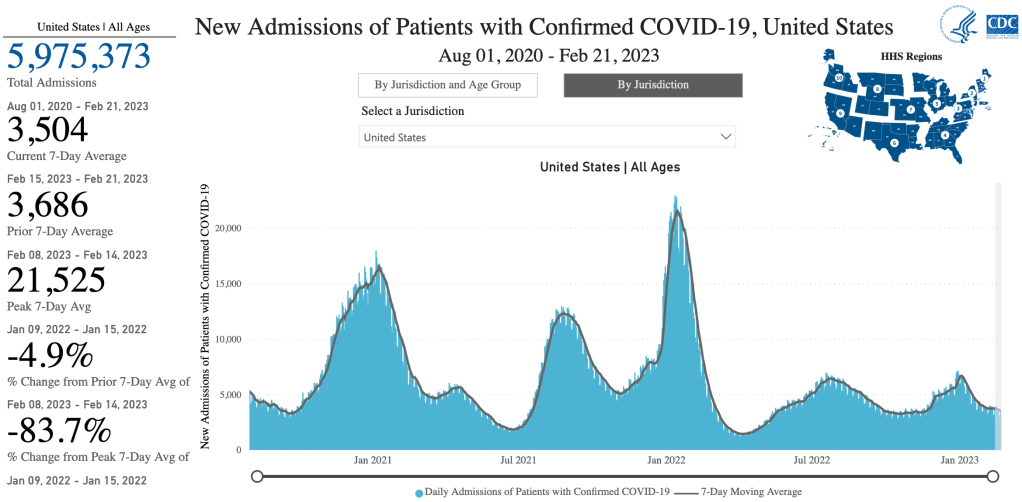
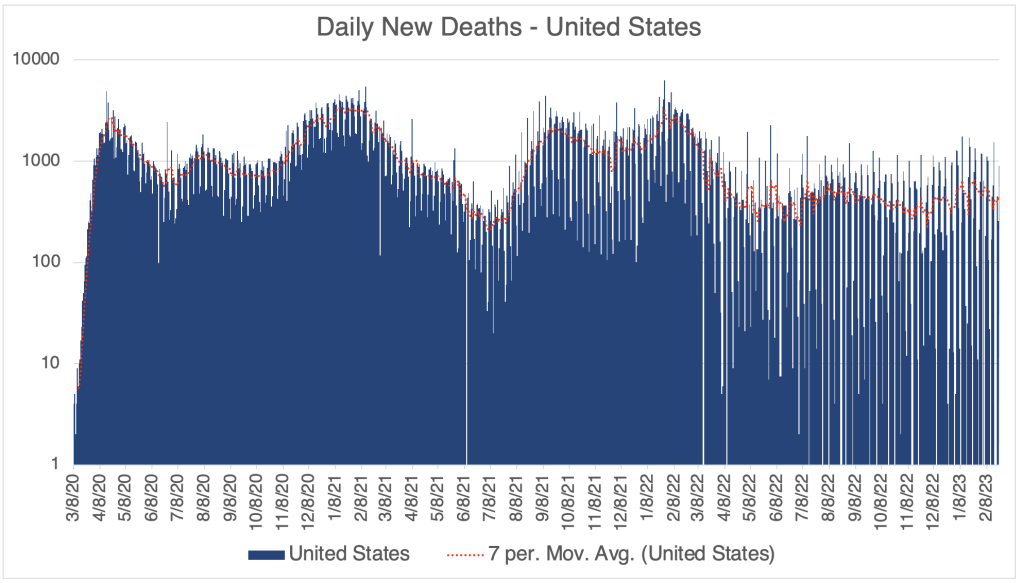
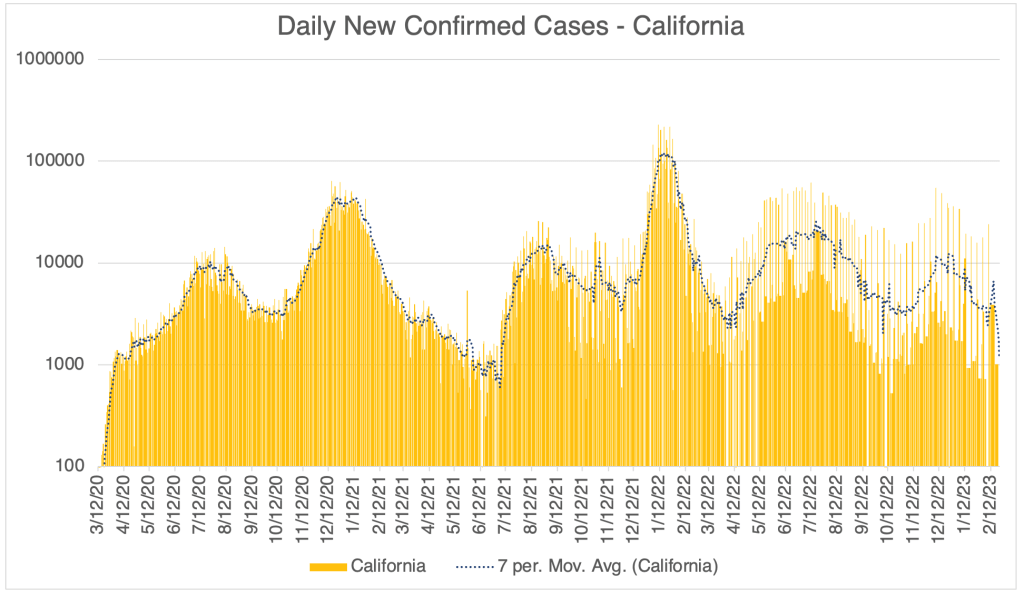
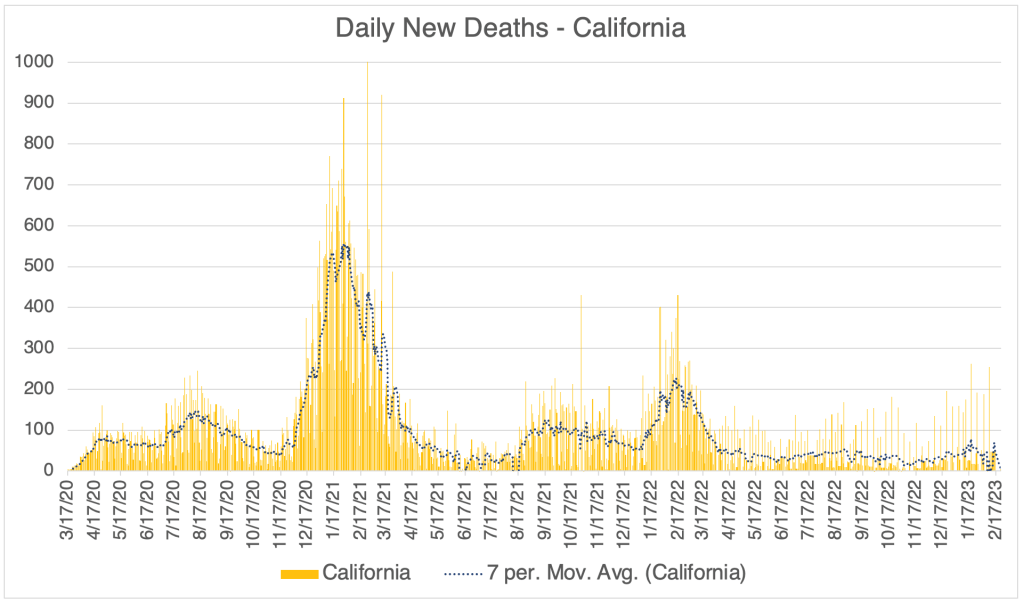
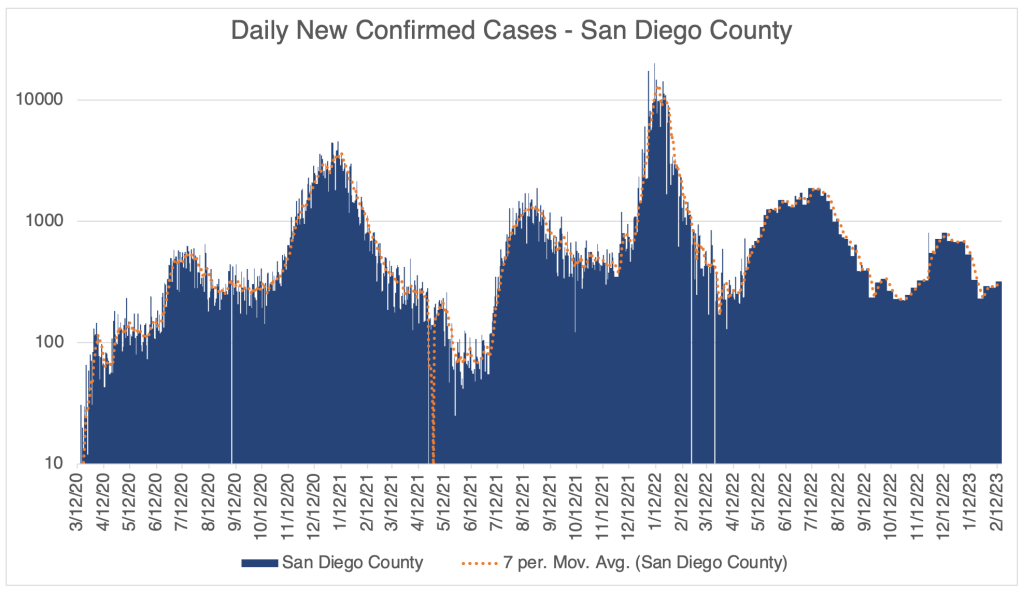
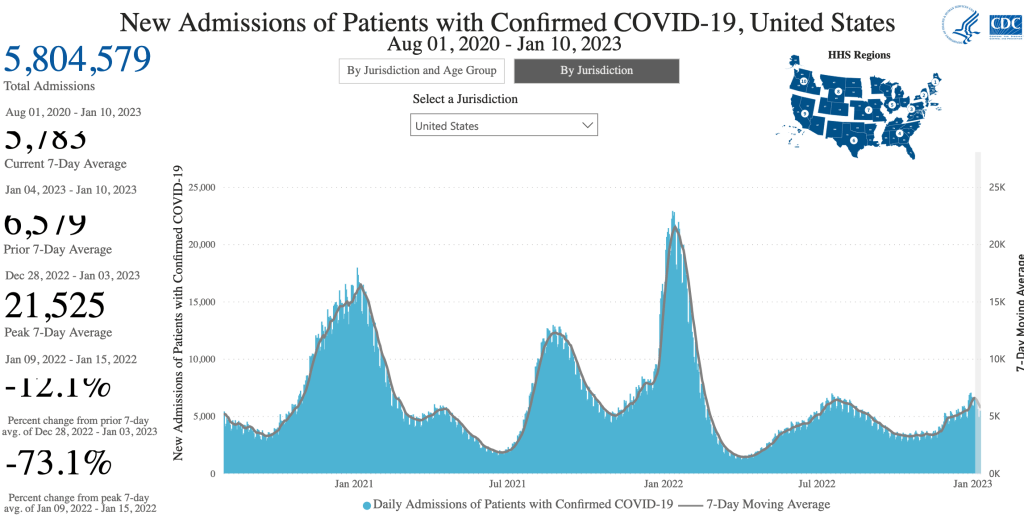
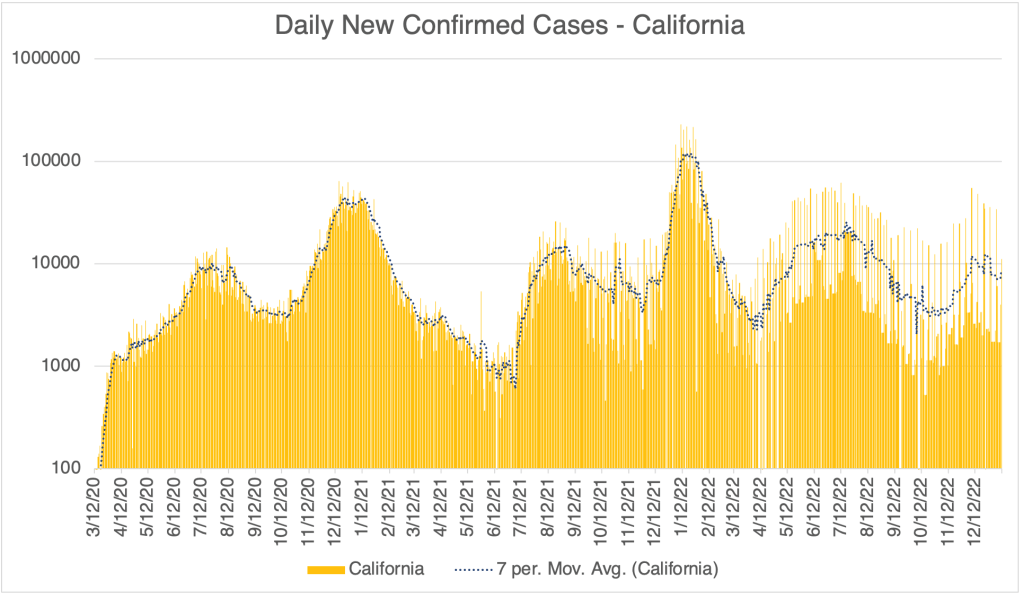
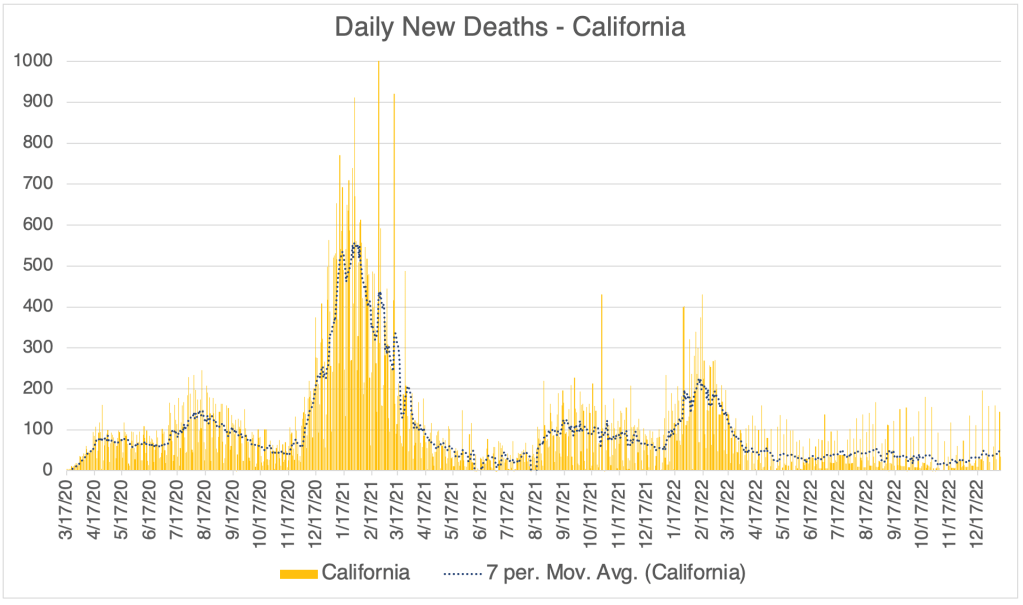
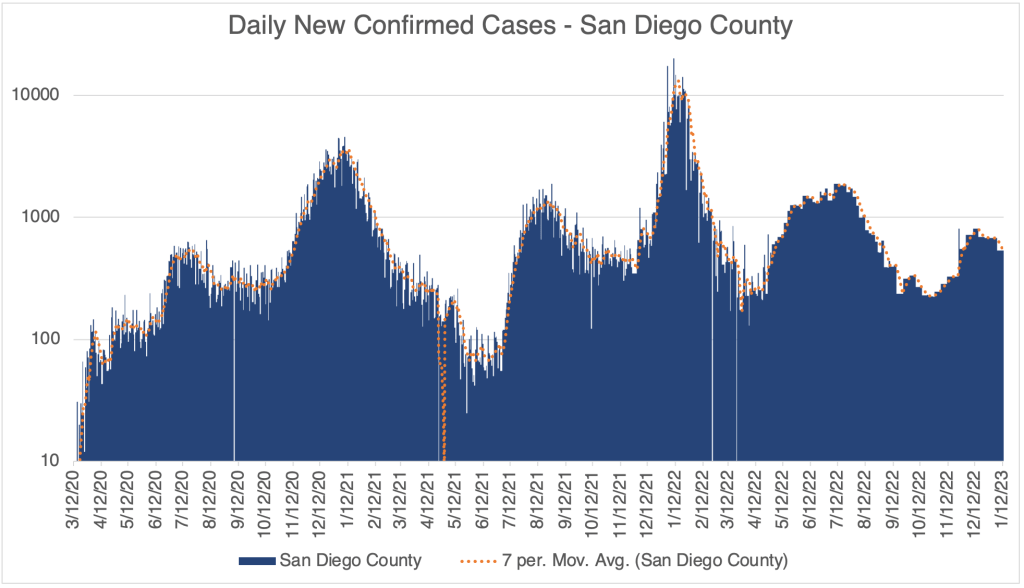
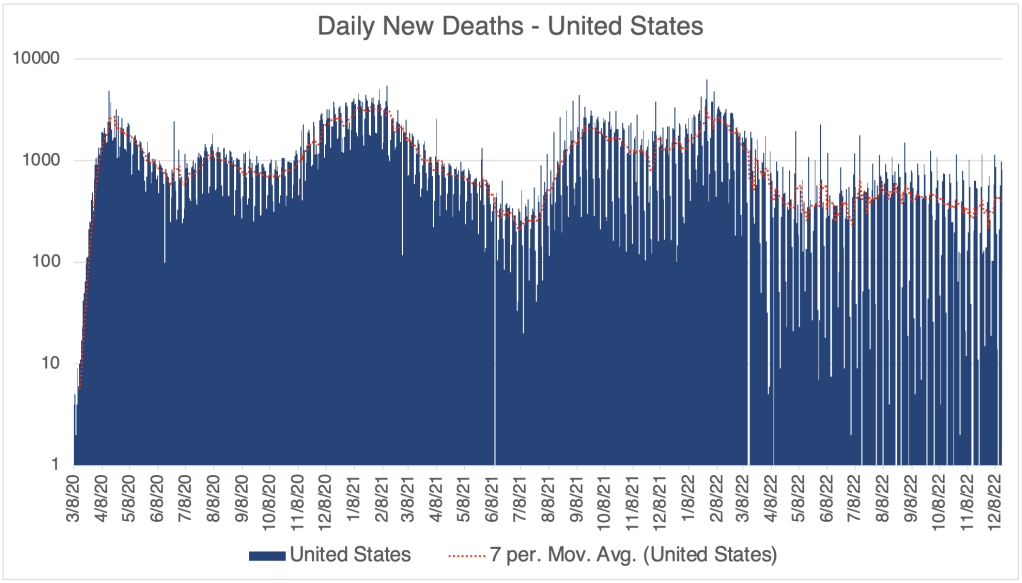
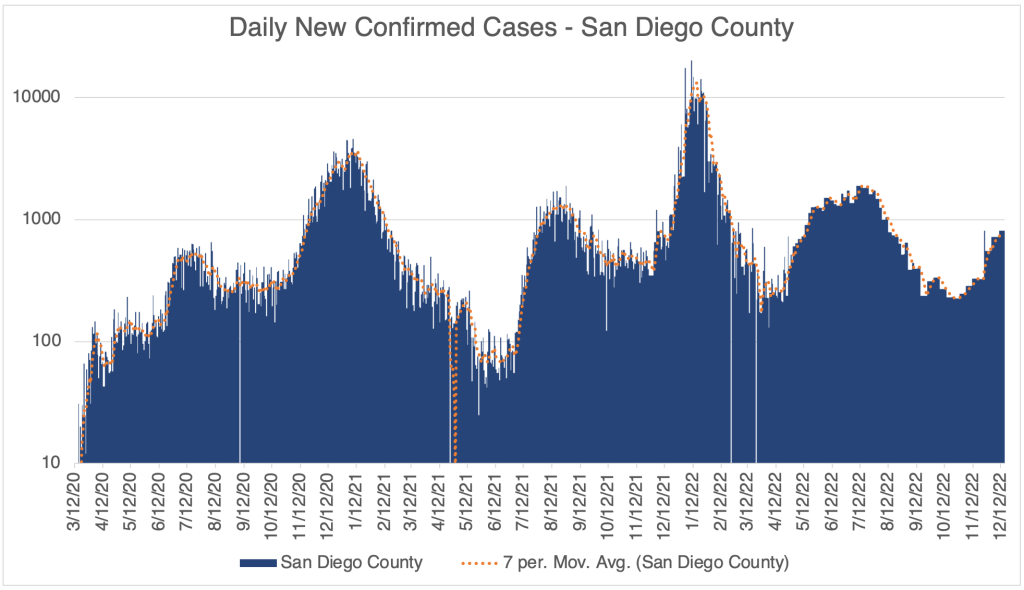
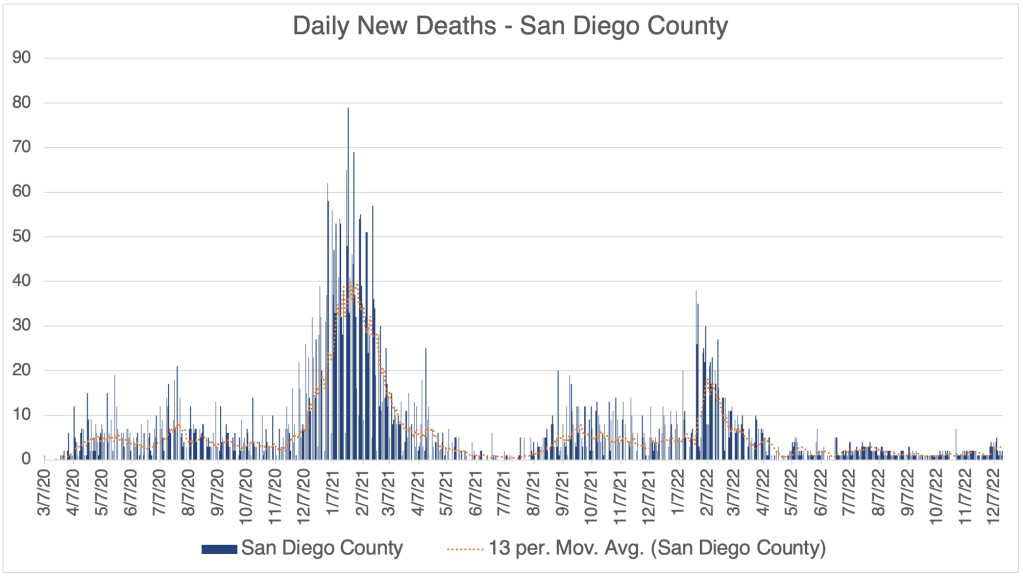
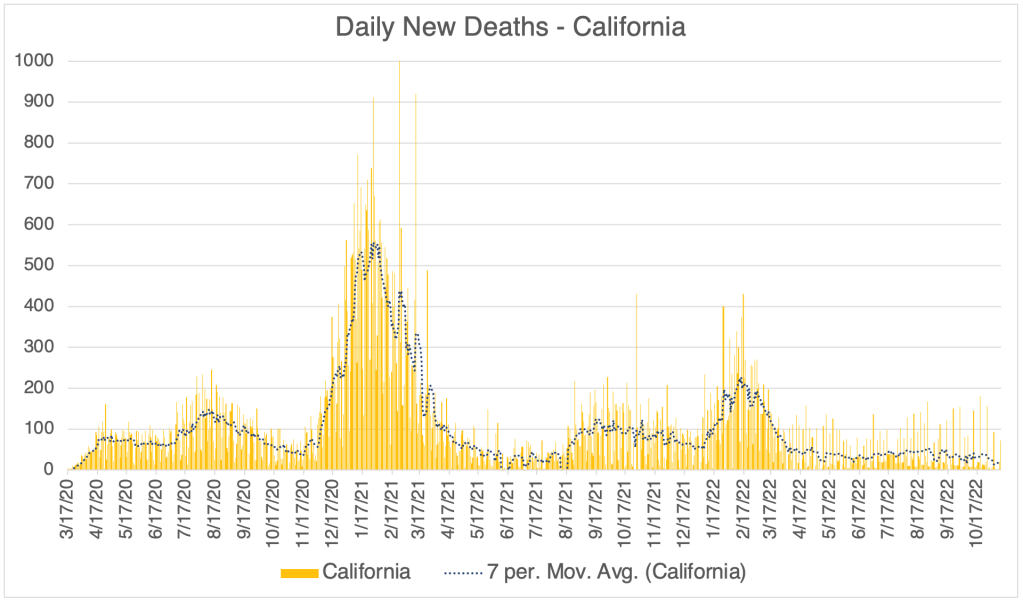
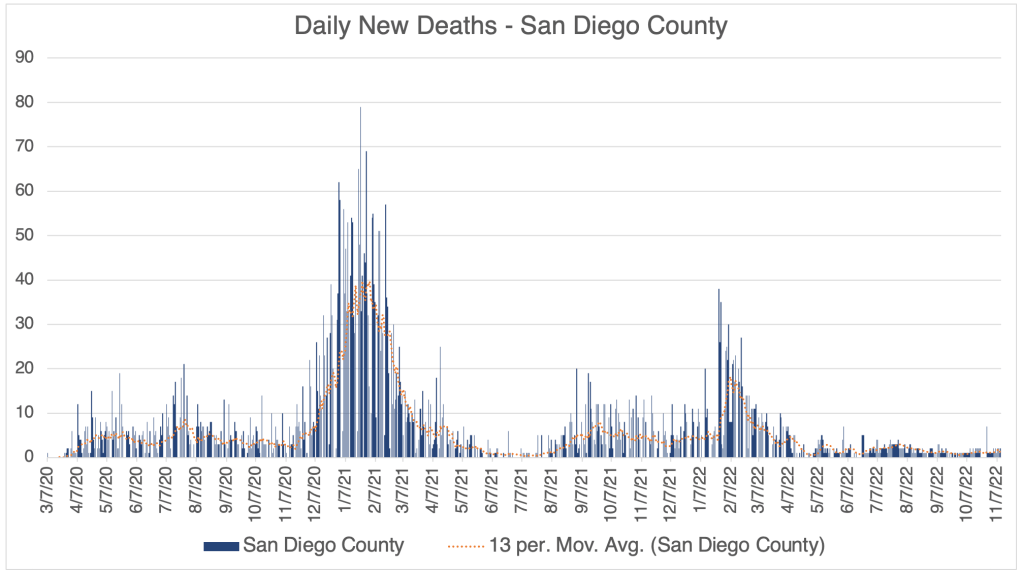
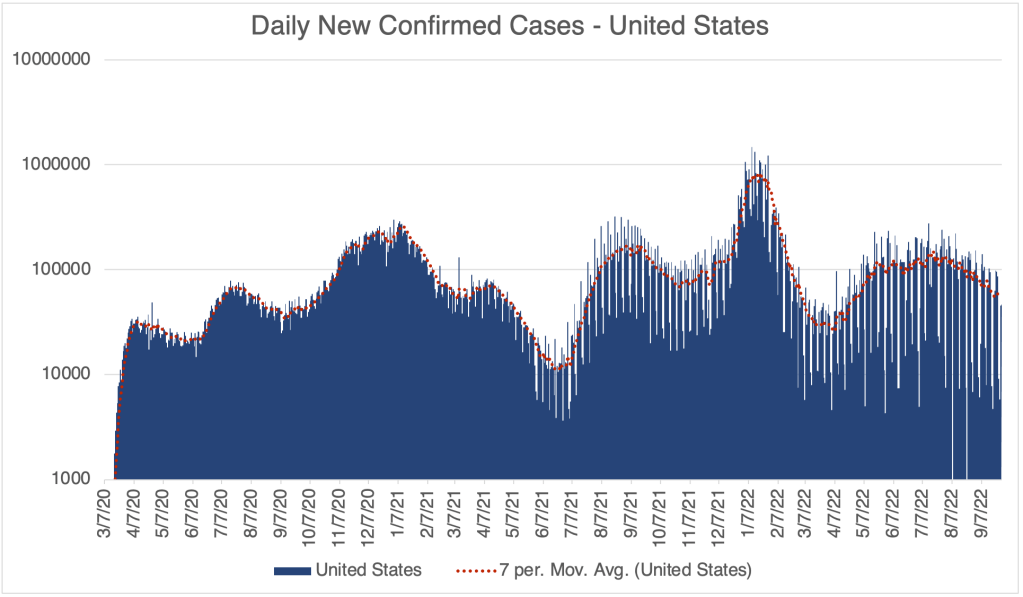
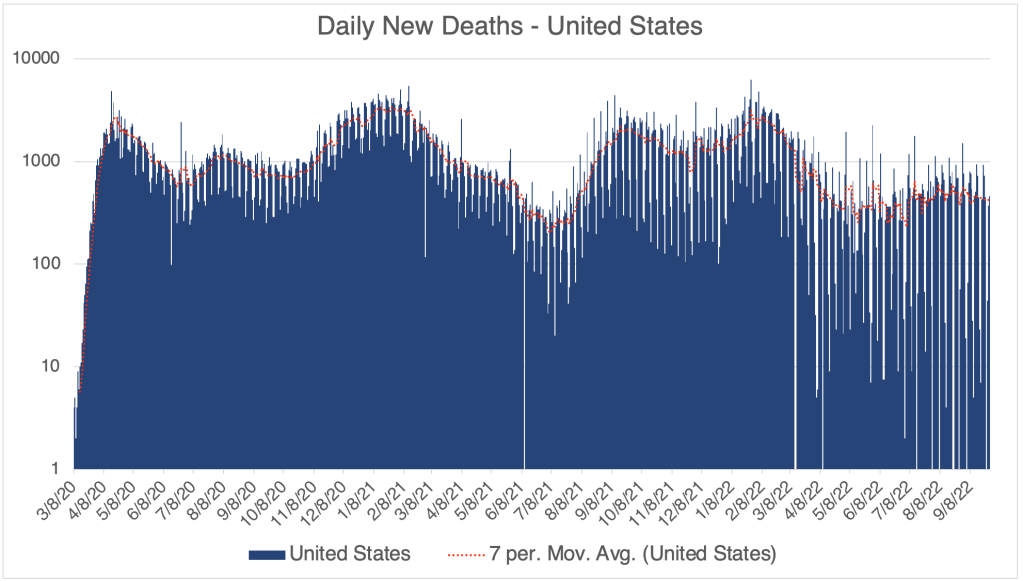
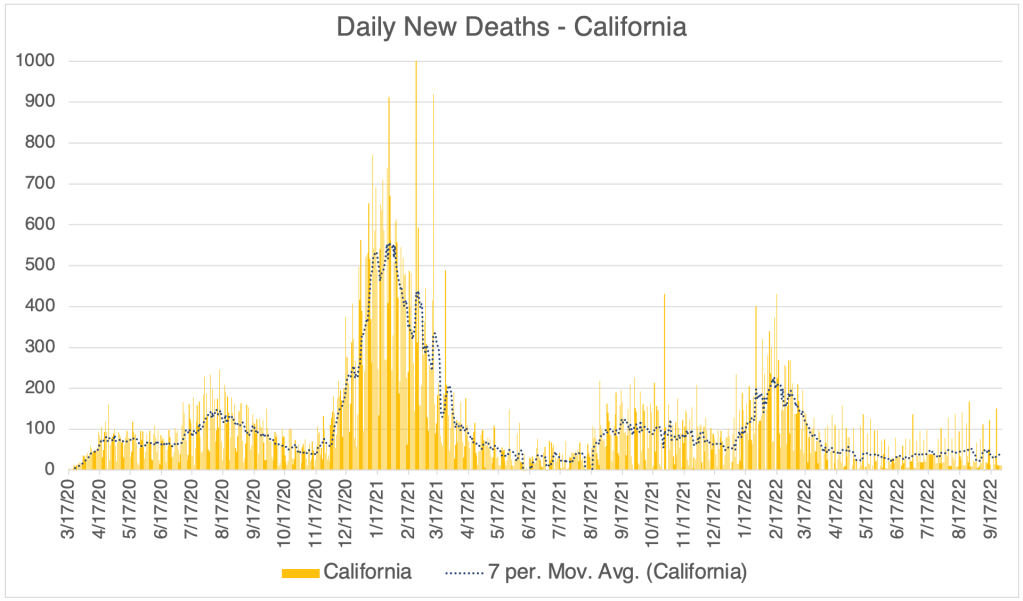
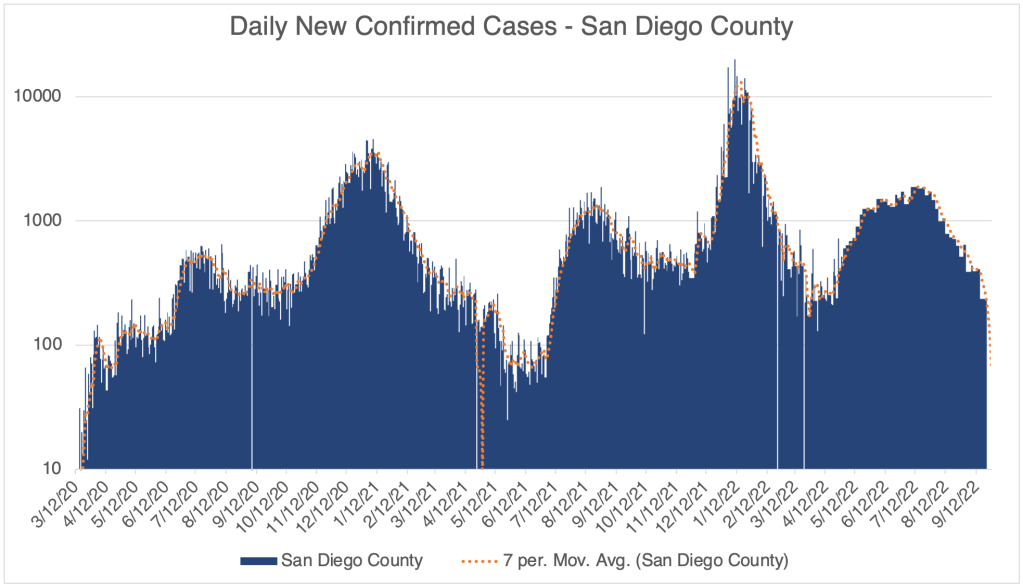
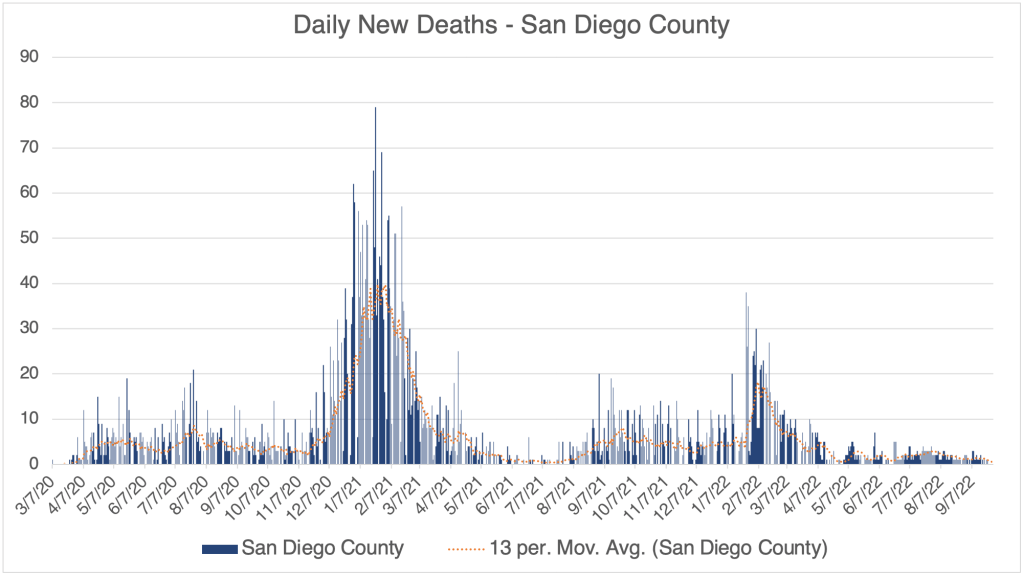
I am only collecting data once a week now, just to monitor new cases, so my graphs are pretty low-resolution. New COVID cases are as low now as they were at the very beginning of the pandemic, even lower than the Spring of 2021 before Delta arose and spoiled the party. New deaths due to infection are also very low. There was an apparent spike in new deaths in San Diego County in mid-July, but this may have represented a bunch of hospitals reporting at once, and not a spike in actual deaths.
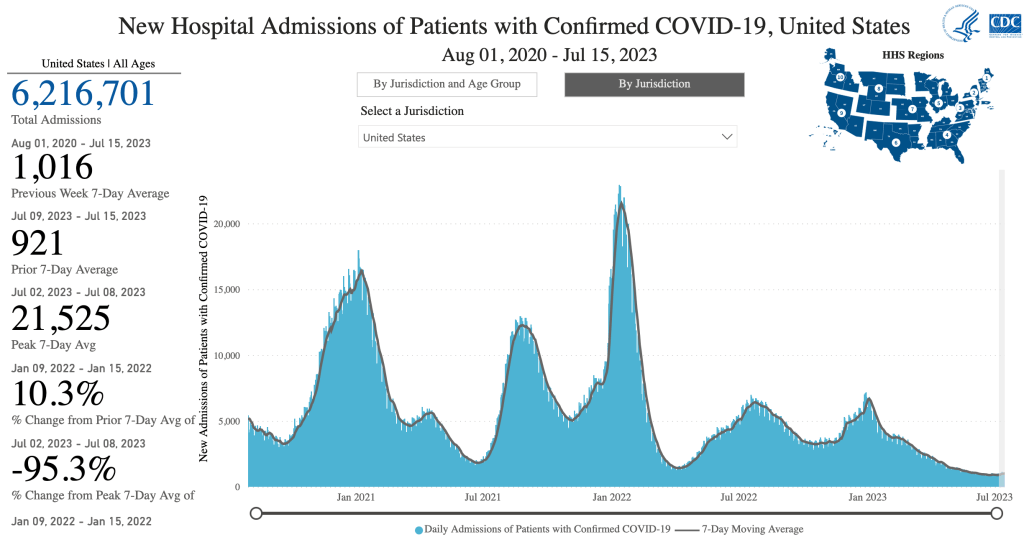
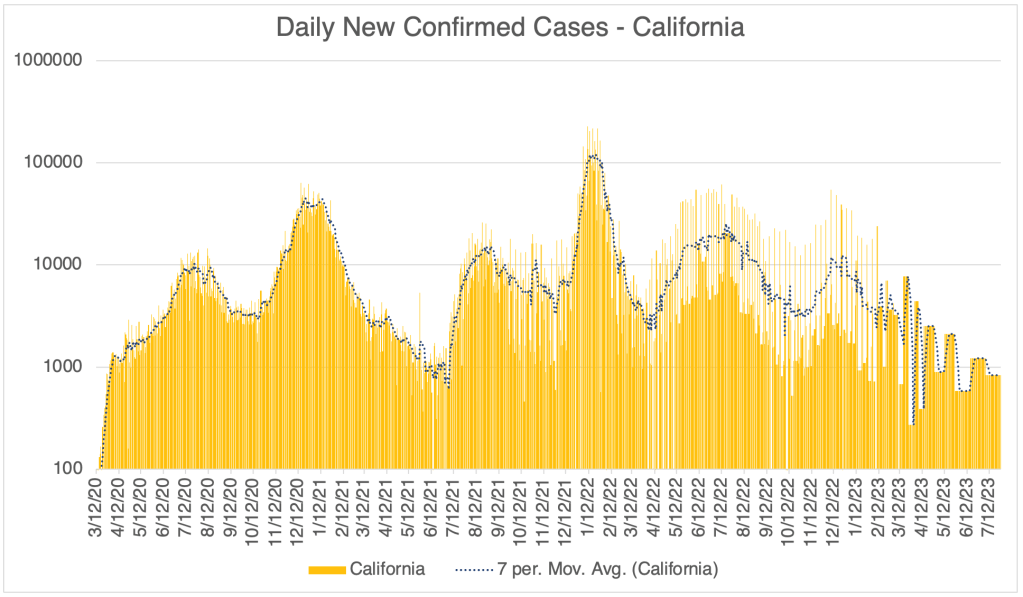
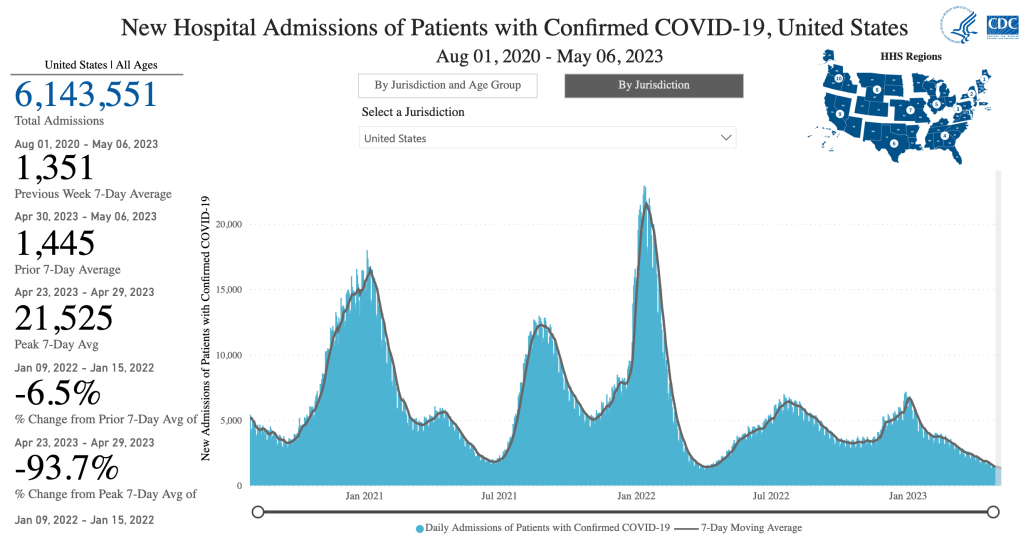
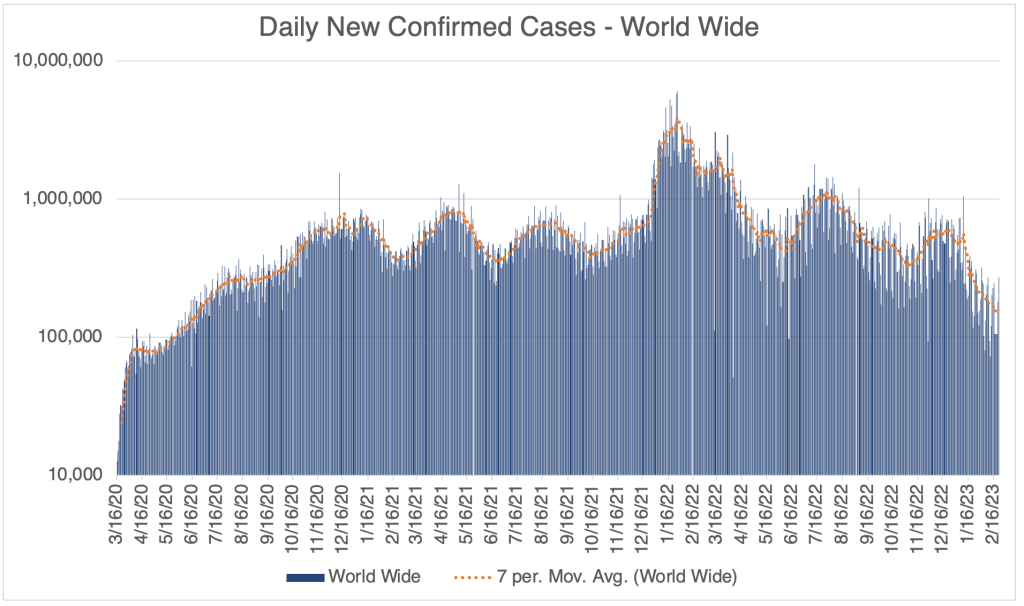
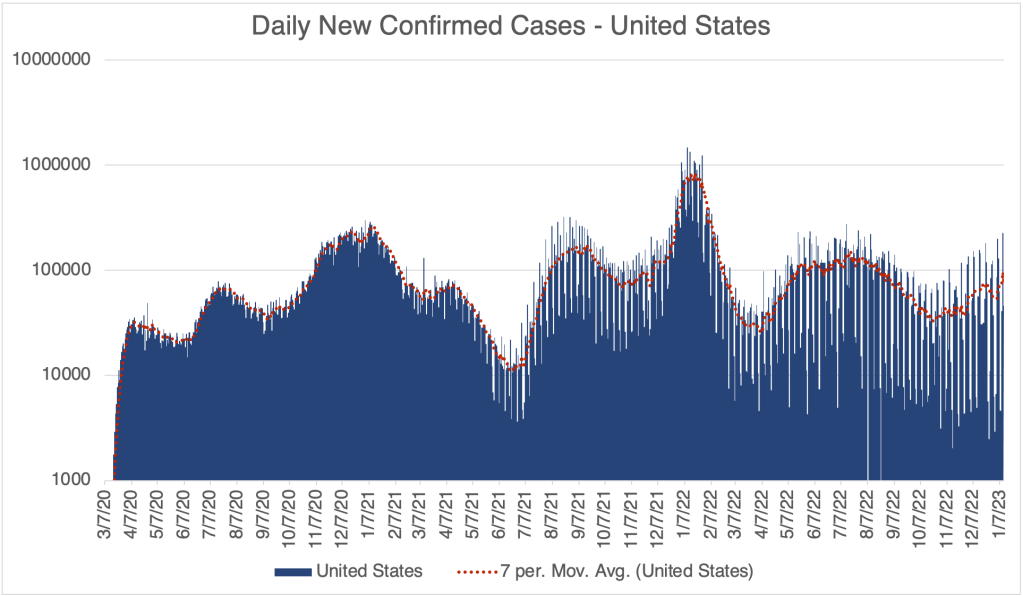
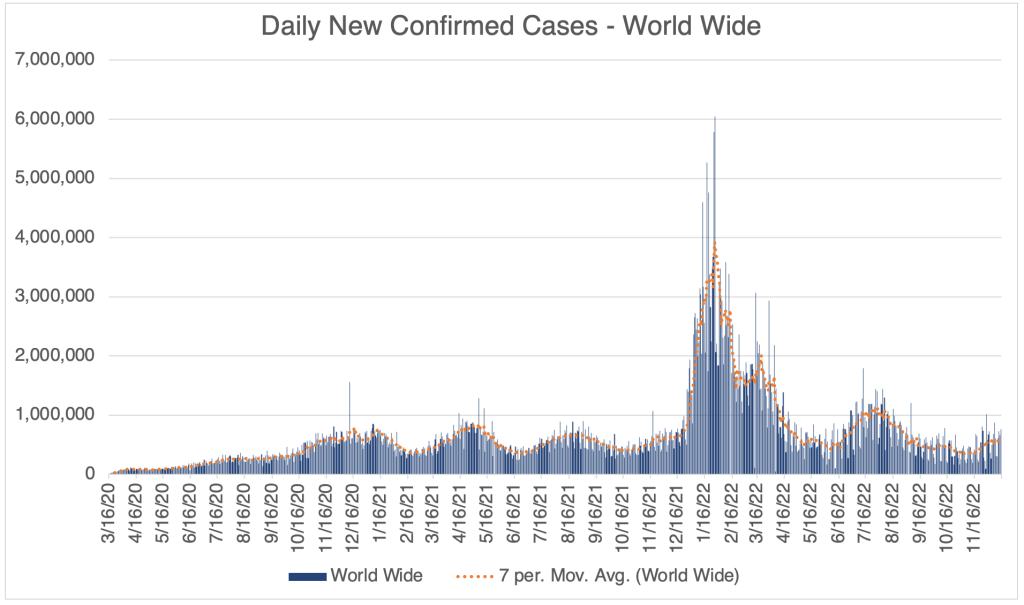
Graph is by me, from data collected from Johns Hopkins University COVID site. Graph is presented in a logarithmic format to emphasize small numbers. Note that each number on the left is 10x higher than the one below it. Data since March 10, 2023 is from Worldometer.Graph is by me, from data collected from Johns Hopkins University COVID site. Graph is presented in a logarithmic format to emphasize small numbers. Note that each number on the left is 10x higher than the one below it. Data since March 10, 2023 is from Worldometer.Hospitalizations, from the CDC website.Graph is by me, from data collected from Johns Hopkins University COVID site. Graph is presented in a logarithmic format to emphasize small numbers. Note that each number on the left is 10x higher than the one below it. Data since March 10, 2023 is from Worldometer.Graph is by me, from data collected from Johns Hopkins University COVID site. Graph is presented in a logarithmic format to emphasize small numbers. Note that each number on the left is 10x higher than the one below it. Data since March 10, 2023 is from Worldometer.Graph is by me, from data collected from San Diego County Public Health. Graph is presented in a logarithmic format to emphasize small numbers. San Diego County now only releases information on Thursday each week. Data points shown are extrapolated using this information.Graph is by me, from data collected from San Diego County Public Health. Graph is presented in a linear format. San Diego County now only releases information on Thursday each week. Data points shown are extrapolated using this information.Graph is by me, from data collected from Johns Hopkins University COVID site. Graph is presented in a logarithmic format to emphasize small numbers. Note that each number on the left is 10x higher than the one below it. Data since March 10, 2023 is from Worldometer.Daily COVID Deaths, World Wide, Worldometer/coronavirus.
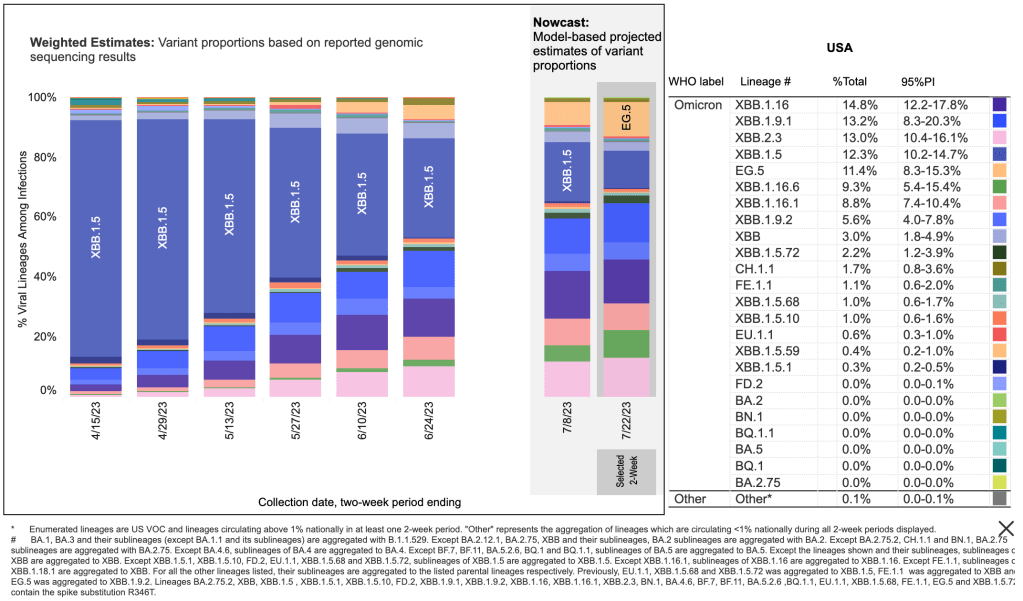
A new Omicron variant, EG.5 is rising in prominence, but this new variant is apparently no deadlier than other Omicron variants, so is not of great concern.
3 “Patient Zero”s identified:Journalist Michael Shellenberger claims that the identities of 3 “patient zero” individuals are now known, and all of them worked at the Wuhan Institute of Virology. These people were likely the very first people in the world to be infected with SARS-CoV-2. One of these individuals is Ben Hu, the 2nd in command at the WIV, and someone who was directly involved in Coronavirus research. Shellenberger was not shocked to discover that the initial patients were from the WIV. Rather, he was shocked and dismayed that he had to discover this for himself, rather than the information be released by the WHO, the CDC, the FBI, or a number of other agencies who should have informed the public. Shellenberger is now 100% convinced that the SARS-CoV-2 virus came from the lab in Wuhan.
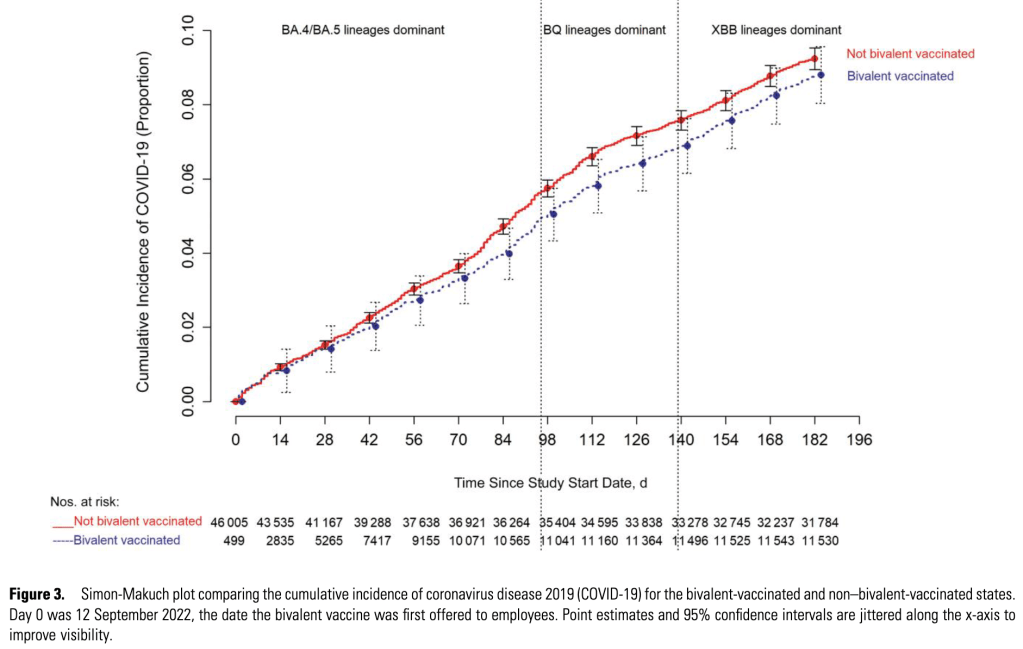
Boosters increase likelihood of reinfection: A study from the Cleveland Clinic claims that the likelihood of reinfection with COVID-19 actually increases with more vaccine boosters. The study began in the Summer of 2022, during the BA.5 outbreak, and shows increased likelihood of infection by later variants the more boosters a person had! It’s unknown why this phenomenon occurs, but it may be a mechanism similar to Antibody Dependent Enhancement (ADE) which I was concerned about early on. Happily, available data doesn’t appear to show that ADE has caused more severe symptoms in COVID patients.
The paper also shows that the new Bivalent boosters, containing both the original Wuhan strain and an Omicron strain, has only a mild benefit to prevent infection.
Adverse events were batch dependent: A paper from a lab in Denmark appears to show that the number of adverse events associated with vaccines, referred to as “suspected adverse effects” (SAEs), were dependent on the batch in question. Adverse events appeared to cluster in 3 groups, some vaccine batches produced very few events, while others produced thousands. This difference probably contributed to the confusion and the difficulty of identifying real problems. The worst batches produced adverse events at a rate of almost 9%, and also produced the most severe effects.
These results should provide some clues as to what went wrong with the vaccine rollout. Unfortunately, this data comes from cases in Denmark so is less relevant to the US. This is the kind of information that is the CDC’s job to produce. The fact that the CDC is not producing data like this is a big worry, and shows that the agency is in dire need of reform.
Excess deaths may be related to vaccine induced inflammation:Ed Dowd was on the Dr. Drew podcast. Dowd has an interesting take on adverse events. He is an analyst for an investment firm, and looks for trends to help in making investment decisions. He often uses information from insurance claims to analyze trends in worker health, illness, accidents, and death. He noticed that in the UK, there were approximately 500,000 excess deaths in both 2021 and 2022, many among younger people. This effect was correlated to being in the Millennial generation and being employed. He says that in late 2021, excess deaths among Millennials was 84% above normal.
He says that hematological (blood related) illnesses were up 522% in 2022, during the time when Omicron was dominant. That’s 61 standard deviations above the expected trend. For those of you who know statistics, you know that this is far, far, above what you would expect for a random event. Dowd is asking physicians to help his team interpret this data.
At this point, it seems unlikely that we will get accurate information on adverse events in the US. Unfortunately, the CDC is too politicized to perform its function.
I’m not a physician. But in my informed opinion, there is no longer a benefit to getting a COVID vaccine booster, even if you are at high risk.
The pandemic is officially ending today in the US. Also, I’ll give a case update.
The CDC has announced that the state of emergency due to the COVID-19 pandemic is officially ending at the end of the day today, May 11, 2023. This will end all federal restrictions for travel, as well as make some regulatory changes to testing, treatments, and funding. Some things are not changing, and the list of changes is complicated. Most people have been behaving as if the pandemic is basically over in my area for many months now, and you may not notice any differences to your life.
Most scientists agree the SARS-2 virus is now endemic, and will continue to circulate. Those with natural immunity will probably not be effected by this, and new cases of COVID will be mild for most. If you are one of the few who haven’t had COVID yet, you may want to continue to take precautions, but most even high risk people I know have chosen to go back to normal life.
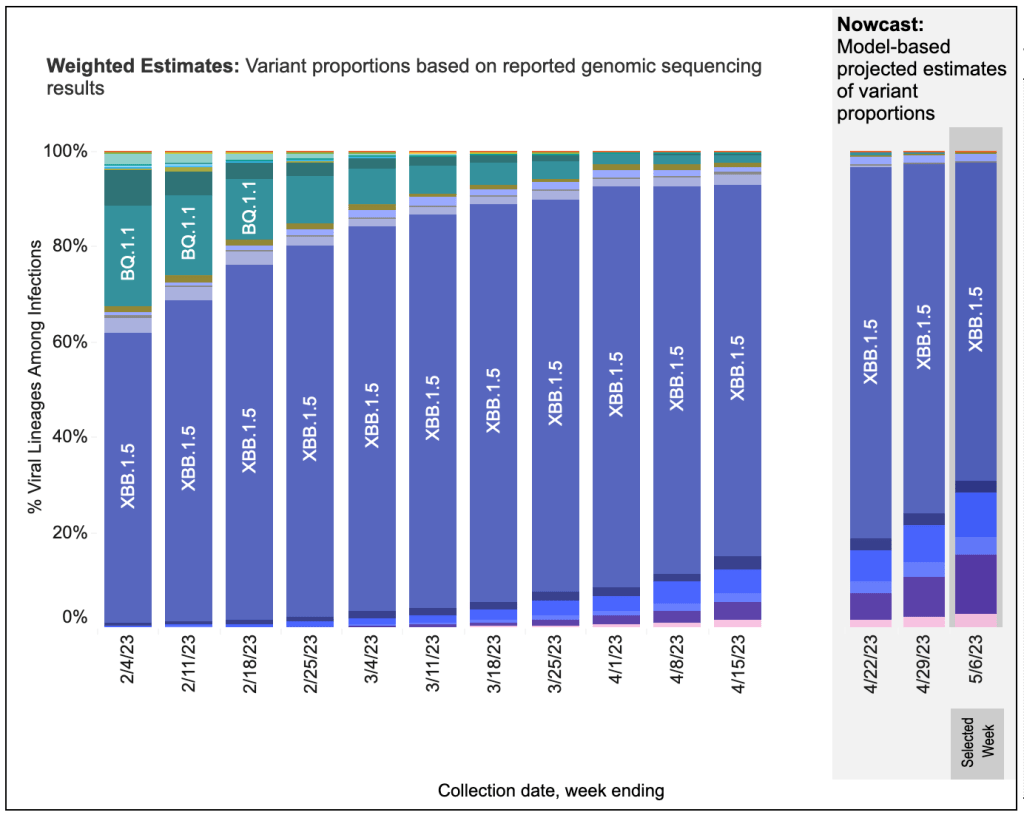
Case update: There are still cases around, but the numbers are low, and we haven’t had a big wave of deaths since the Omicron variant arrived in December and January of 21/22.
Graph is by me, from data collected from Johns Hopkins University COVID site. Graph is presented in a logarithmic format to emphasize small numbers. Note that each number on the left is 10x higher than the one below it. Data since March 10, 2023 is from Worldometer.Graph is by me, from data collected from Johns Hopkins University COVID site. Graph is presented in a logarithmic format to emphasize small numbers. Note that each number on the left is 10x higher than the one below it. Data since March 10, 2023 is from Worldometer.Hospitalizations, from the CDC website.From the CDC page on Variant Proportions for the United States. Updated for May 6th, 2023.Graph is by me, from data collected from Johns Hopkins University COVID site. Graph is presented in a logarithmic format to emphasize small numbers. Note that each number on the left is 10x higher than the one below it. Data since March 10, 2023 is from Worldometer.Graph is by me, from data collected from Johns Hopkins University COVID site. Graph is presented in a logarithmic format to emphasize small numbers. Note that each number on the left is 10x higher than the one below it. Data since March 10, 2023 is from Worldometer.Graph is by me, from data collected from San Diego County Public Health. Graph is presented in a logarithmic format to emphasize small numbers. San Diego County now only releases information on Thursday each week. Data points shown are extrapolated using this information.Graph is by me, from data collected from San Diego County Public Health. Graph is presented in a linear format. San Diego County now only releases information on Thursday each week. Data points shown are extrapolated using this information.Graph is by me, from data collected from Johns Hopkins University COVID site. Graph is presented in a logarithmic format to emphasize small numbers. Note that each number on the left is 10x higher than the one below it. Data since March 10, 2023 is from Worldometer.Daily COVID Deaths, World Wide, Worldometer/coronavirus.
As I stated above, the SARS-2 virus is now endemic, and we’ll probably never be completely rid of it. But it’s significance will continue to decline as new variants continue to become less pathogenic, and the human population continues to build resistance.
I’m going to re-post my lessons from the pandemic below.
This is NOT a case update! In fact, there may be no more case updates from me!
In another sign that the pandemic is basically over, Johns Hopkins University announced that as of 5:21 am, March 10, 2023, they would no longer refresh their COVID page which supplied so many of us with current COVID information. This page was regarded by most to be the most authoritative repository of COVID information, although it depended on governmental bodies to supply them with information. With this resource gone, anyone wanting to keep track of data will need to go to less authoritative or less convenient sources.
Since the rise of Omicron, COVID hasn’t been nearly as deadly as previous variants. So after December and January of ‘21/’22, there has not been a big deadly wave of cases. Despite this, many news outlets continued to talk about the next big variant as a source of concern. My primary reason for my updates in the last year has been to simply show you that while cases may ebb and flow, deaths were not really on the rise. I wanted to give you the raw data so you could see this for yourselves.
Now that the JHU site will be going away, I’ll probably post even less, or maybe not at all, only when newsworthy items appear. If an issue arises involving case numbers, I’ll try my best to find good information, perhaps from Worldometer, to pass along.
In the future, just remember that viruses tend to become more infectious and less pathogenic over time. So when some news source comes out and talks about how terrifying a new variant is because it’s so infectious, just realize it’s also probably less pathogenic than previous versions. If you’ve had COVID before, it most likely won’t be a concern for you at all.
By the way, some of you may wonder why I don’t comment on some of the COVID related news that comes out. Usually, this is because I’ve written about it before, or because I don’t really have anything new to add to the conversation. I’ve always wanted to be as concise and impactful as possible, and so I’ve kind of avoided the “Water is Wet” stories. If you want me to cover something in particular, feel free to reach out.
Don’t fear, but be smart, Erik
____________________________________________ Update: March 14th, 2023
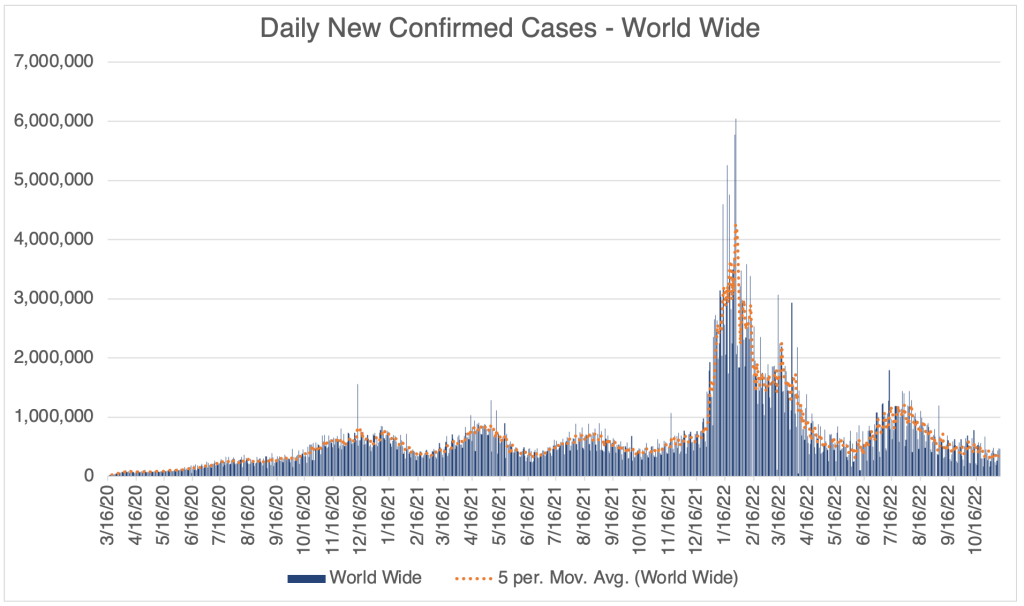
A brief post with another piece of good COVID news that I’ve never noticed before. I was just looking at Worldometer‘s graph of Daily COVID Deaths world wide, a number I haven’t been tracking. Notice how low daily deaths have been since just after the Omicron variant appeared in late 2021. After a big spike that Winter, deaths have been much lower world wide. Truly, Omicron washed Delta away and likely saved many lives! Amazing!
This is a COVID Update. I’ll also talk about a recent meta-study by Jefferson et al about mask effectiveness.
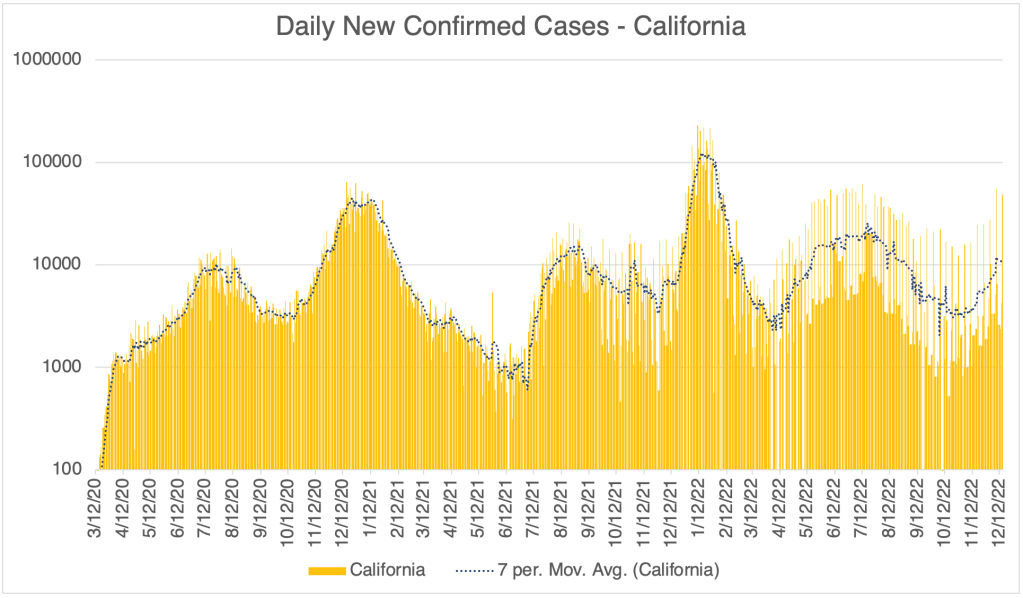
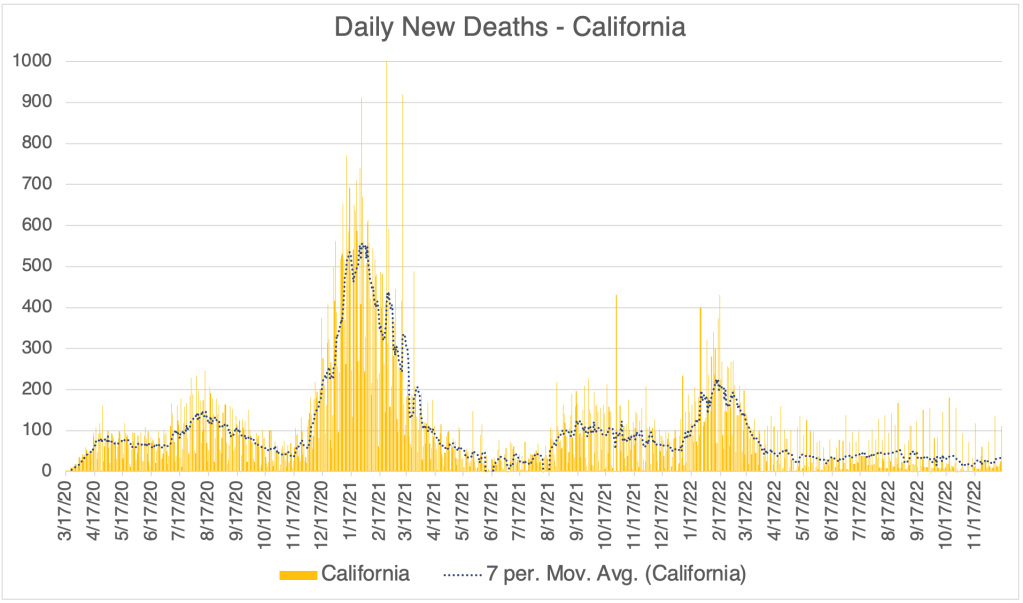
The Winter wave is over. Cases in the US, California, and San Diego County are about at the same level as they were in October. This the mildest COVID winter season since the pandemic started. COVID related deaths increased modestly during this time, but are now relatively low but persistent.
Graph is by me, from data collected from Johns Hopkins University COVID site. Graph is presented in a logarithmic format to emphasize small numbers. Note that each number on the left is 10x higher than the one below it.Hospitalizations, from the CDC website.Graph is by me, from data collected from Johns Hopkins University COVID site. Graph is presented in a logarithmic format to emphasize small numbers. Note that each number on the left is 10x higher than the one below it.From the CDC page on Variant Proportions for the United States. Updated for February 18th.From the CDC page on Variant Proportions for the United States. Updated for February 18th.Graph is by me, from data collected from Johns Hopkins University COVID site. Graph is presented in a logarithmic format to emphasize small numbers. Note that each number on the left is 10x higher than the one below it.Graph is by me, from data collected from Johns Hopkins University COVID site. Graph is presented in a linear format.Graph is by me, from data collected from San Diego County Public Health. Graph is presented in a logarithmic format to emphasize small numbers. San Diego County now only releases information on Thursday each week. Data points shown are extrapolated using this information.Graph is by me, from data collected from San Diego County Public Health. Graph is presented in a linear format. San Diego County now only releases information on Thursday each week. Data points shown are extrapolated using this information.
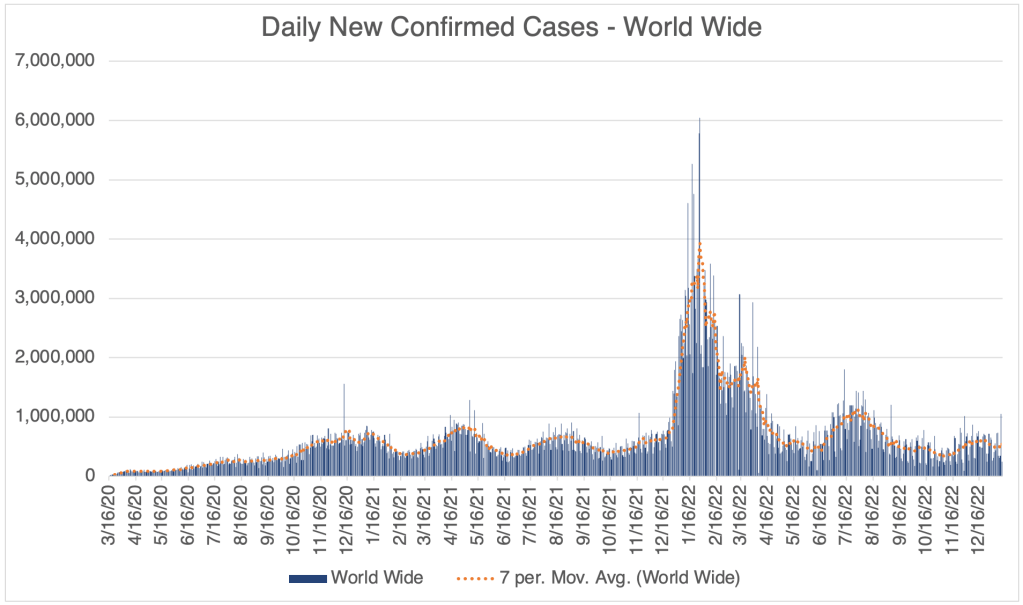
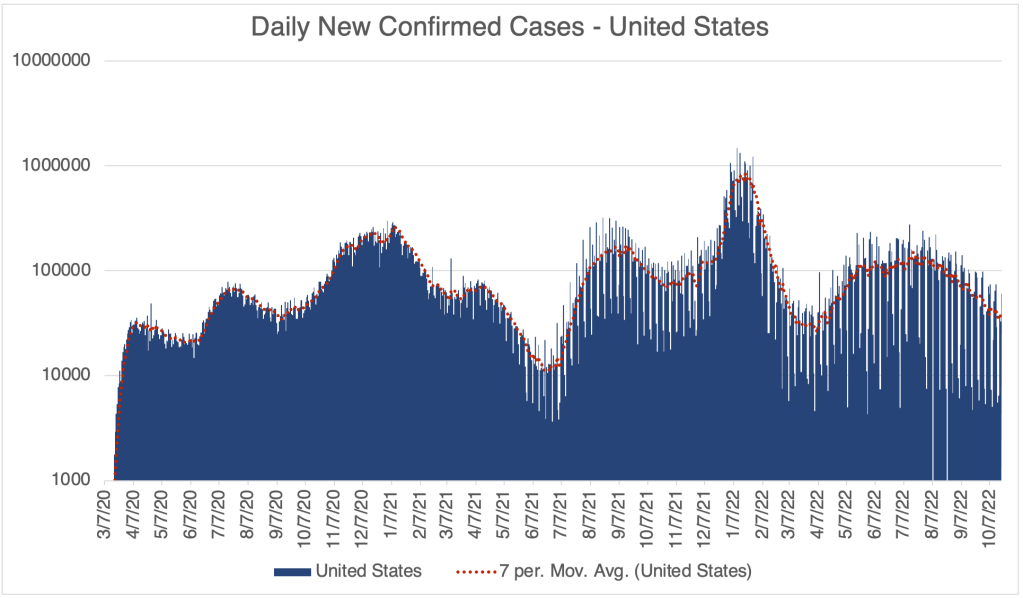
World wide, cases are as low now as they were way back in the Summer of 2020. Of course, I have to mention that testing was not as available in 2020 as it is now. On the other hand, many people currently are testing themselves with over the counter tests, and don’t report the results to the medical system, so there is a lot of uncertainty as to the actual number of cases.
Graph is by me, from data collected from Johns Hopkins University COVID site. Graph is presented in a logarithmic format to emphasize small numbers. Note that each number on the left is 10x higher than the one below it.
Cochrane Report on the Effectiveness of Masks: Jefferson et al released a meta-study through Cochrane Reviews on the effectiveness of medical masks (surgical masks) and medical respirators (N95) in public settings. A meta-study is a study in which the authors gather information from published articles and try to draw conclusions from a large body of data. They do not gather a new set of data.
The Jefferson et al study reviewed 78 different studies, including data from pre-COVID flu outbreaks. Their conclusions are sobering. First, the authors suggest that there is virtually no benefit to wearing a medical surgical mask over not wearing a mask in most settings. If you’ve been reading my blog for long, you will know that this conclusion does not surprise me. Blue surgical masks have large gaps in the sides and do not filter air leaving the mouth and nose. They were designed to prevent droplets from a medical worker from contacting a patient, not to prevent transmission of aerosol based agents. This is a problem, since most mask wearing people in public during the pandemic were wearing surgical masks. These people thought they were protected from aerosols, but they were not.
The study also concludes, however, that N95 masks didn’t perform much better. In fact, for lab tested COVID, the difference was statistically insignificant, meaning that the difference between wearing N95s or surgical masks was so small, it could not be proven to be a real difference statistically.
I have to point out that the Jefferson meta-study points out that many of the studies they reviewed had various failings that may have made them unreliable. Much of the data was collected through self-reporting of participants, which is a source of inaccuracy, and participants were often non-random, making application to the general population difficult. So some of the conclusions may have suffered from these kinds of errors.
As you know, I’ve been a proponent of wearing N95, KN95, or KF94 masks when indoors during the pandemic. Unfortunately, N95s are tight and intolerable for most people for long periods, so most people didn’t want to wear them at all. Those that did were not careful to make sure the mask fits properly, making the mask ineffective. This is part of the reason I wore a KF94 (Korean) during the later stages of the pandemic when I had choices.
So have I been wrong this whole time? Well, yes and no. I wore a KN95 in all kinds of environments while traveling during the pandemic. When I finally got COVID in January of 2022, I was not wearing my mask, working in a “gray area” environment with people that I later found out had COVID. I was technically indoors, but the room had a lot of ventilation, so I thought I would be OK. Obviously, I was incorrect. All this to say, I think my KN95 was effective for much of the pandemic. On the other hand, I am a scientist in the infectious disease field, and have had a lot of experience wearing and fitting these masks to myself, so I am not a typical user. It may certainly be that my experience does not translate to non-scientists.
If you still have not had COVID and are not high risk, I might say that the current version has an extremely low fatality rate, and it may now be worth the risk to say good-bye to the mask. I know the large majority of you have done this already.
If you are at high risk, I still think an N95, KN95, or KF94 can be effective for you. In order for it to be effective, however, you need to make sure it is properly fitted, making sure you don’t have gaps between your nose and cheek. The mask should filter the air coming into your nose and mouth.
Since I had COVID last January, I no longer wear a KN94, and enjoy eating indoors in restaurants again. I’ve basically been back to normal for a long time.
Happy New Year! I have a brief COVID update for you. Then I’ll talk about a new variant, XBB.1.5. I’ll also have comments on a smattering of evolving stories, like California AB 2098, “Physicians and surgeons: unprofessional conduct”, and a new Twitter Files thread on vaccine misinformation.
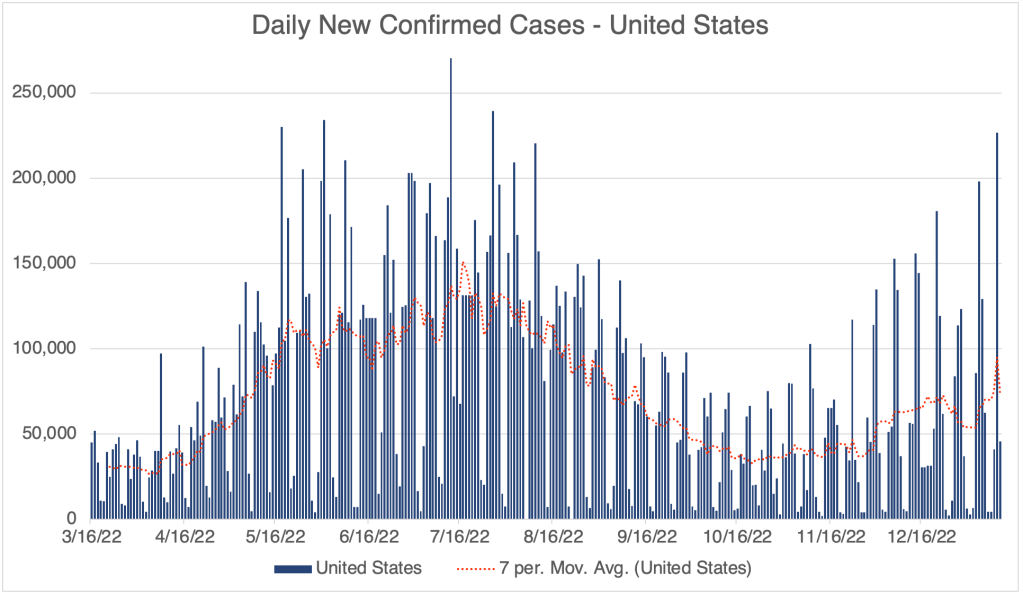
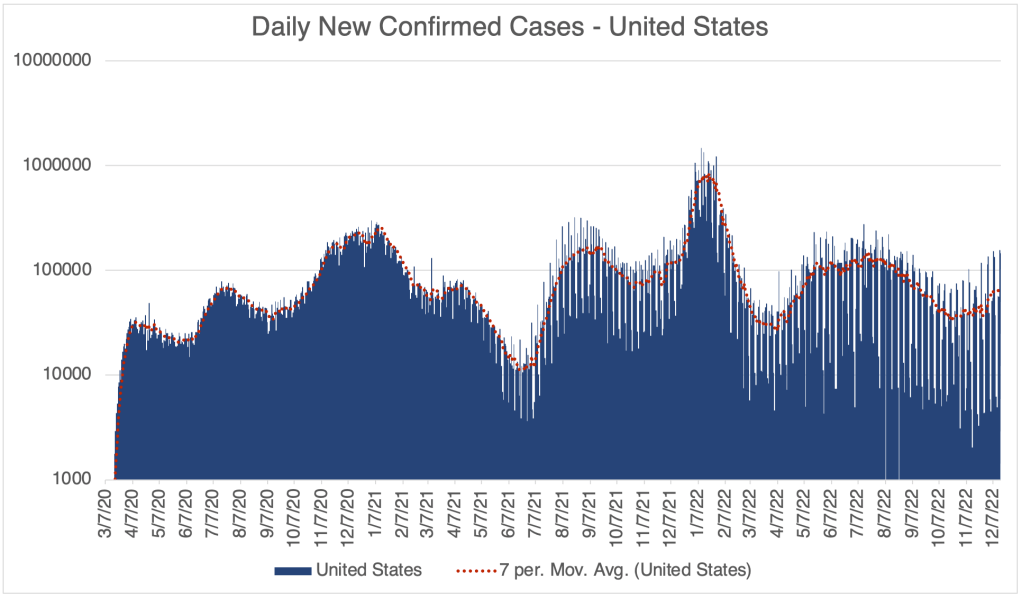
We have already reached the peak of the December wave. Cases in the US, California, and San Diego, and even world wide, peaked at around Christmas. Deaths never really had a peak during this December wave, except in San Diego County.
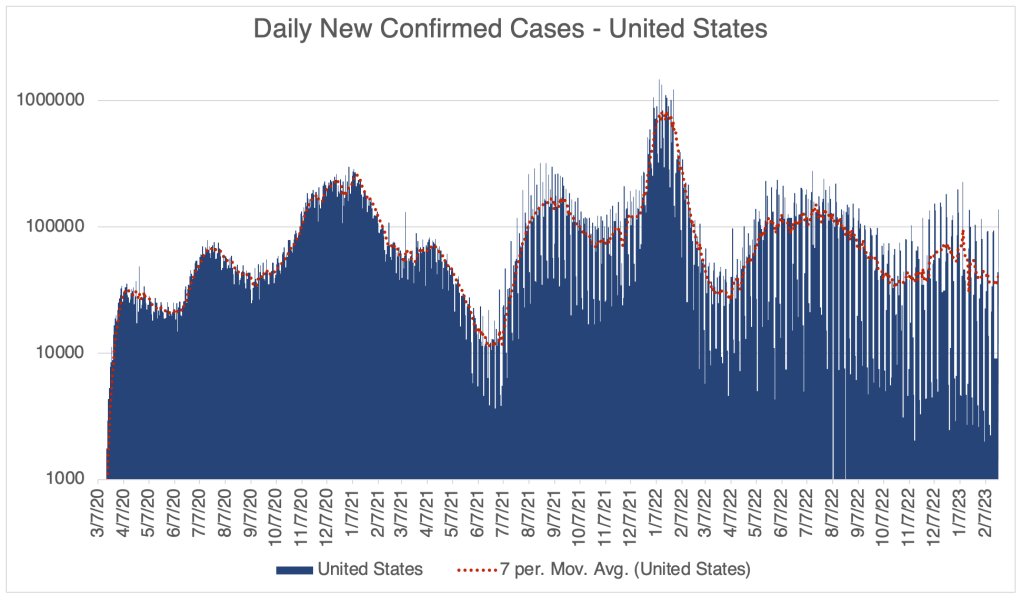
Graph is by me, from data collected from Johns Hopkins University COVID site. Graph is presented in a logarithmic format to emphasize small numbers. Note that each number on the left is 10x higher than the one below it.Daily Confirmed Cases – United States, March 16, 2022 to January 12, 2023. Peak of the first Winter Wave was on around Christmas Day. We may already be seeing the start of an XBB.1.5 peak. Graph is by me, from data collected from Johns Hopkins University COVID site. Graph is presented in a linear format.Hospitalizations, from the CDC website.Graph is by me, from data collected from Johns Hopkins University COVID site. Graph is presented in a logarithmic format to emphasize small numbers. Note that each number on the left is 10x higher than the one below it.Graph is by me, from data collected from Johns Hopkins University COVID site. Graph is presented in a logarithmic format to emphasize small numbers. Note that each number on the left is 10x higher than the one below it.Graph is by me, from data collected from Johns Hopkins University COVID site. Graph is presented in a linear format.Graph is by me, from data collected from San Diego County Public Health. Graph is presented in a logarithmic format to emphasize small numbers. San Diego County now only releases information on Thursday each week. Data points shown are extrapolated using this information.Graph is by me, from data collected from San Diego County Public Health. Graph is presented in a linear format. San Diego County now only releases information on Thursday each week. Data points shown are extrapolated using this information.Graph is by me, from data collected from Johns Hopkins University COVID site. Graph is presented in a linear format.
However, we may see a second Winter wave this year…
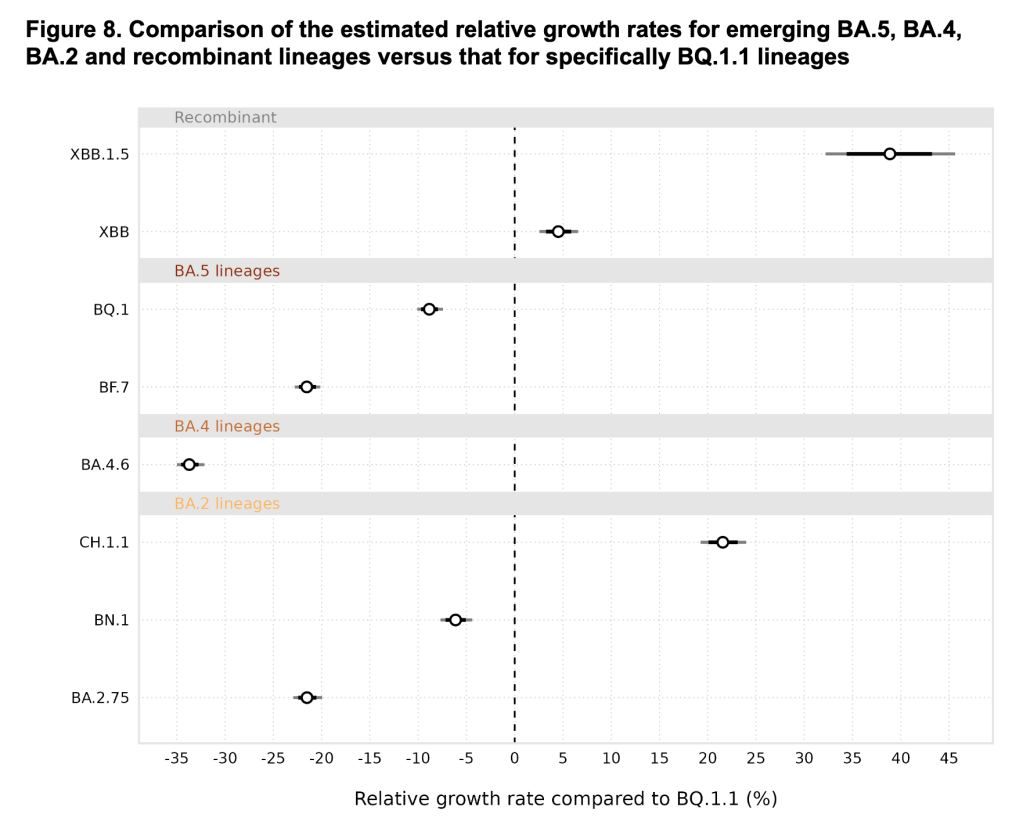
New Variant XBB.1.5: A new variant is spreading extremely rapidly in the US right now. Variant XBB.1.5 is about 43% of the SARS-2 virus in the US right now. A UK study suggests that this new variant is the most transmissible yet. John Campbell, in another excellent analysis, suggests that about 80% of us will get it. Antibody studies suggest that even those with prior COVID infections do not produce many antibodies that can neutralize XBB.1.5, so even those who have had COVID before are likely to get it again. The good news is, XBB.1.5 is another Omicron strain, and will produce very mild symptoms in the vast majority of cases. I’ve had COVID twice already, and I will treat XBB.1.5 as a chance to get a free booster.
From the CDC page on Variant Proportions for the United States. Updated for January 14th.From the CDC page on Variant Proportions for the United States. Updated for January 14th.XBB.1.5 is the most infectious of the current variants, and perhaps the most infectious variant to date. From the UK Health Security Agency, Technical Briefing 49.
Despite the likely mildness of XBB.1.5, do others a favor and stay at home if you have COVID. The over-the-counter antibody based COVID tests do not work very well, so if you are sick but have a COVID negative antibody test, you should assume you have COVID. Only a PCR test can tell you if you’re really negative.
If you haven’t yet had COVID, I can no longer recommend that you get a vaccination or a booster, even if you are in an at-risk group. If you are concerned about getting COVID, consider taking precautions instead. Wear a N95, KN95, or KF94 rated medical respirator when indoors in public. It’s also important to make sure your mask fits snugly. The mask must filter air coming into your nose and mouth. Loosely fitting masks with large gaps will not do this. Do not wear a cloth or surgical mask. These masks will not protect you from XBB.1.5.
California Physician Misinformation Act: On October 4th, 2022, I wrote about California AB 2098. This new law went into effect on January 1st and adds “the dissemination of misinformation or disinformation related to the SARS-CoV-2 coronavirus” to the definition of unprofessional conduct for physicians in California. Unprofessional conduct can result in the suspension or loss of license for physicians in California.
Just yesterday, I had lunch with a friend of mine who is a doctor in California. I asked him how he is dealing with this new law. He said most of the doctors at his hospital follow the official guidance promoting vaccination, and the few who don’t have become very quiet about vaccines. Doctors can’t say anything negative about the vaccine, for the risk of their medical license.
In 2021, this same doctor was coerced into getting the vaccine to retain his position at the hospital. He got a booster later in the year. A month after receiving his booster, despite being very physically fit for his age, he had a heart attack. His cardiologist said he had none of the arterial plaques that typically cause heart attacks. My friend cannot prove this, but he strongly suspects that clotting due to the vaccine contributed to his heart attack. Despite all this, he does not feel at liberty in California to give information to patients that would reflect negatively on the vaccines.
Because this law is so new, I don’t yet know how it will be handled by the Medical Board of California. If they choose to ignore it, then doctors won’t be under threat. However, doctors and pharmacists have lost their licenses in the last few years for violating CDC guidelines, so the threat is a real one.
If you live in California, you cannot expect your doctor to give you their honest opinion about vaccines. This is literally illegal now. Consider writing your state senator or assemblymember and ask them to support the repeal of AB 2098.
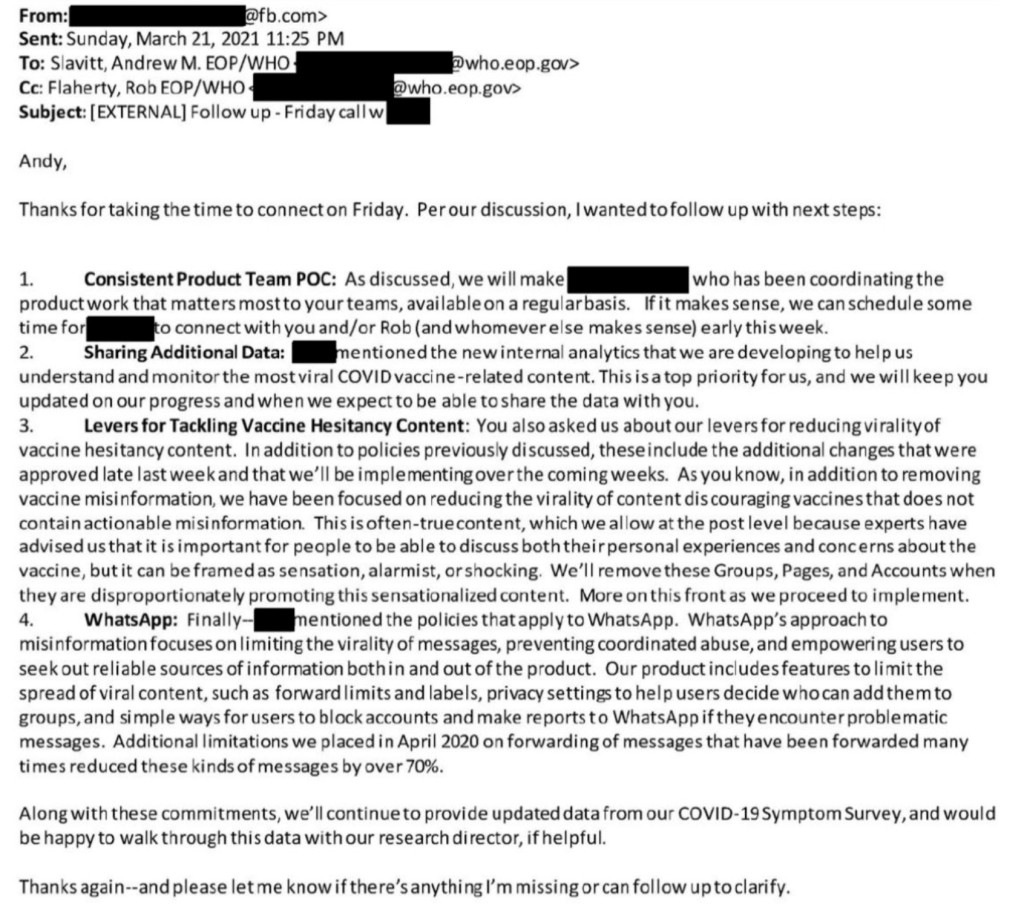
The Twitter Files have exposed a trove of evidence that official government agencies have been coercing several social media companies to censor COVID related information. In an amazing post from Michael Shellenberger, a F@¢eb00k official recently revealed that F@¢eb00k was reducing content not because they thought it was misinformation, but simply because it had a sensationalist tone. In an email to a Whitehouse official, the F@¢eb00k employee wrote:
“As you know, in addition to removing vaccine misinformation, we have been focused on reducing the virality of content discouraging vaccines that does not contain actionable misinformation. This is often-true content, which we allow at the post level because experts have advised us that it is important for people to discuss both their personal experiences and concerns about the vaccine, but it can be framed as sensation, alarmist, or shocking.”
Obviously, these efforts to limit expression by a government agency is a violation of the first amendment, our most important freedom. There are now many, many examples of this in the Twitter files, relating to COVID, and other matters.
This is a COVID update. Then I’ll discuss the high number of RSV and flu cases right now. I’ll also discuss the issue of vaccination induced blood clotting and the film “Died Suddenly”.
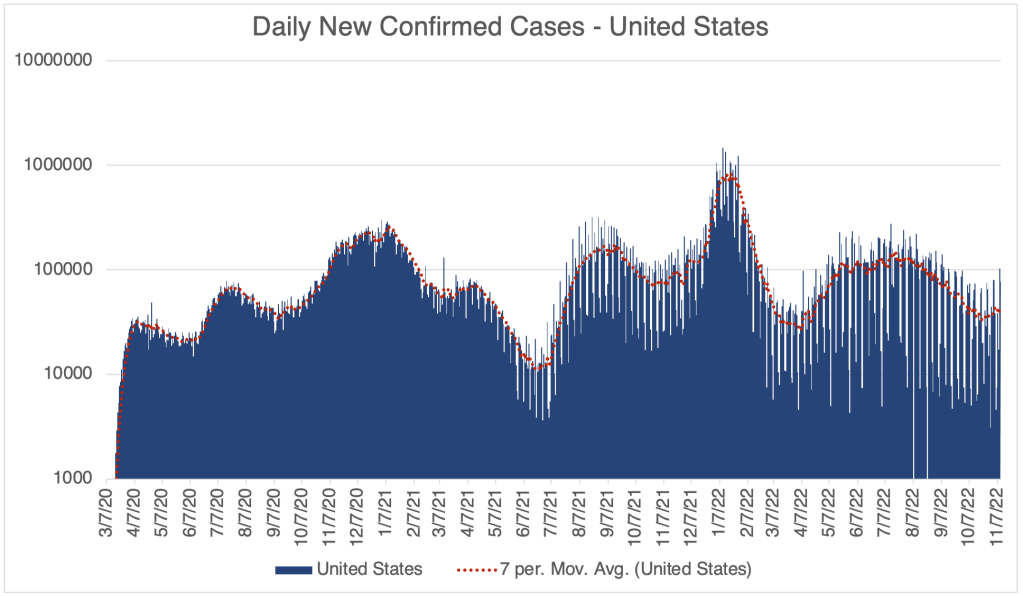
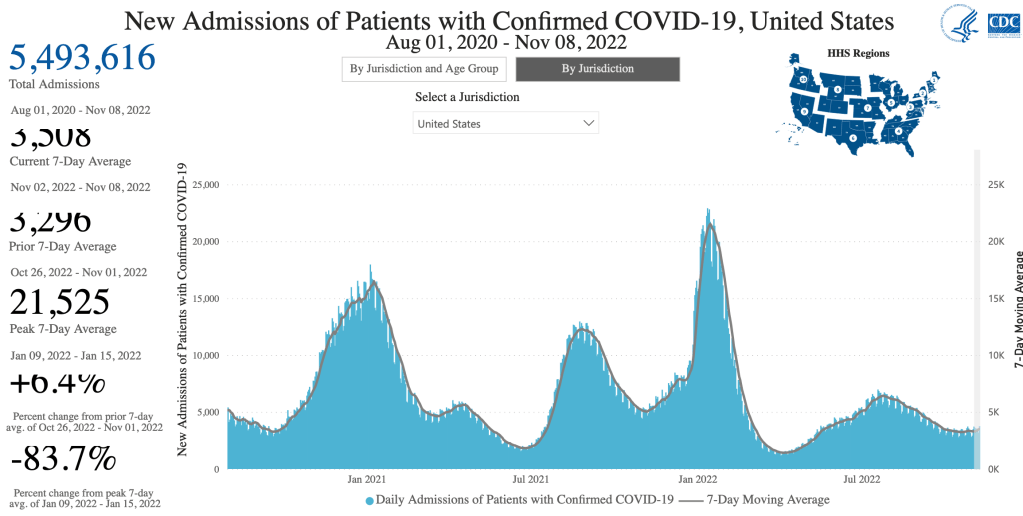
There has been a modest rise in cases in the past few weeks, suggesting that we will have a winter wave of cases. So far, this wave is not nearly as high as last December, when the Omicron variant first became dominant in the US. This is according to official testing data. Many are no longer being testing in a medical setting, so the number is likely much higher.
Graph is by me, from data collected from Johns Hopkins University COVID site. Graph is presented in a logarithmic format to emphasize small numbers. Note that each number on the left is 10x higher than the one below it.Graph is by me, from data collected from Johns Hopkins University COVID site. Graph is presented in a logarithmic format to emphasize small numbers. Note that each number on the left is 10x higher than the one below it.Hospitalizations, from the CDC website.Graph is by me, from data collected from Johns Hopkins University COVID site. Graph is presented in a logarithmic format to emphasize small numbers. Note that each number on the left is 10x higher than the one below it.Graph is by me, from data collected from Johns Hopkins University COVID site. Graph is presented in a linear format.Graph is by me, from data collected from San Diego County Public Health. Graph is presented in a logarithmic format to emphasize small numbers. San Diego County now only releases information on Thursday each week. Data points shown are extrapolated using this information.Graph is by me, from data collected from San Diego County Public Health. Graph is presented in a linear format. San Diego County now only releases information on Thursday each week. Data points shown are extrapolated using this information.Graph is by me, from data collected from Johns Hopkins University COVID site. Graph is presented in a linear format.
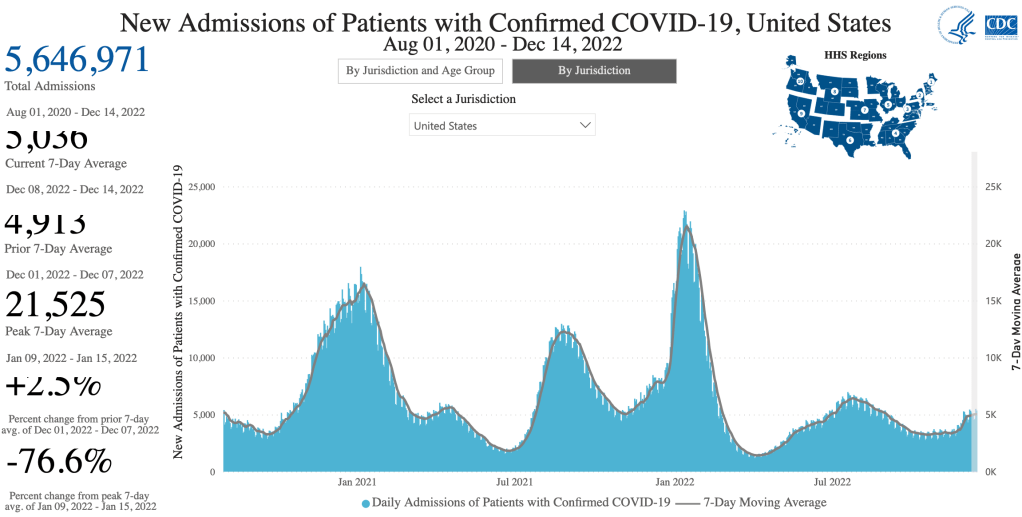
Hospitalization data provides a better relative view of cases, since it shows how many are actually entering the medical system with moderate to severe cases, but San Diego County is no longer providing this information on their website.
As we’ve discussed before, the drug store tests are not nearly as sensitive as a PCR test, and I know several people who were negative by this kind of test for days after symptoms began. The drug store tests can tell you if you have COVID, but false negatives are common, so if you get a negative result, it doesn’t mean much. If you really need to know if you have COVID, get a PCR test.
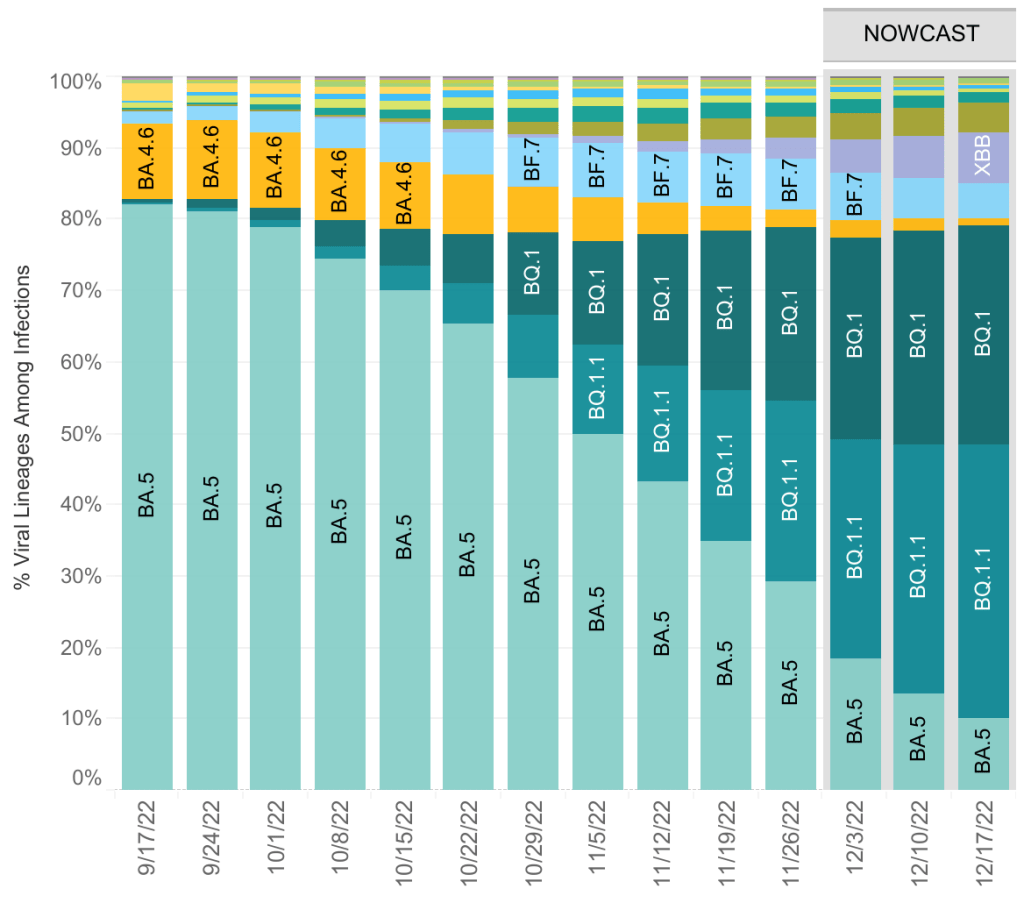
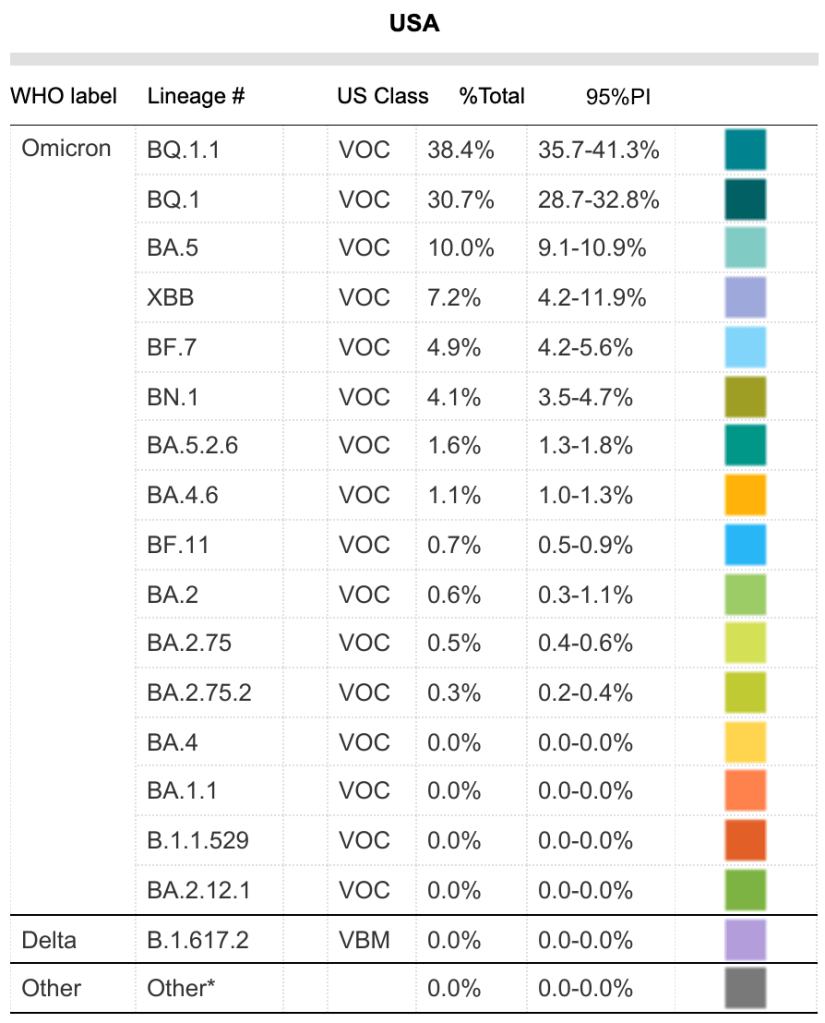
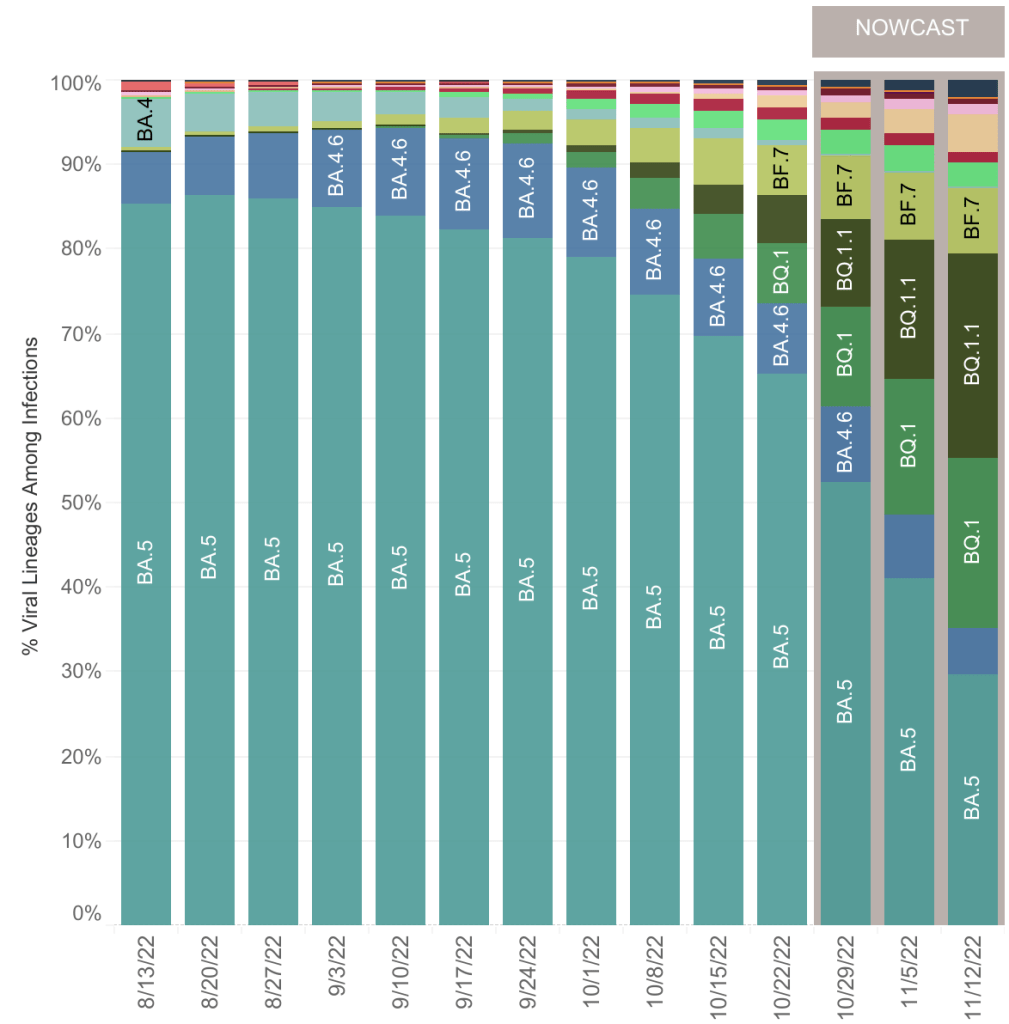
The BA.5 variant now represents only 10% of currently circulating COVID variants. There are currently 12 variants circulating in significant numbers, the most common being BQ.1.1.
From the CDC page on Variant Proportions for the United States. Updated on December 17th.From the CDC page on Variant Proportions for the United States. Updated on December 17th.
Tridemic: A physician friend of mine who works in urgent care joked that we are currently in a “tridemic”, by which he meant that there a lot of COVID, Flu, and RSV cases right now. Everyone knows about the flu, but many are unfamiliar with RSV. Well, actually, you are. Respiratory Syncytial Virus (RSV) is one of the several viruses that are responsible for what we call the common cold. You have likely had it many times in your life.
For most people, RSV is just an annoyance, but it can be serious for infants, causing bronchiolitis, a swelling of lung tissues. If your infant is coughing a lot, breathing rapidly, wheezing, or just breathing noisily, contact your doctor. Those with infants in their life may consider taking extra precautions to avoid passing along a cold. The blue surgical masks are not a good defense against COVID, but they are effective to prevent droplets which transfer colds and flus.
Many guess that RSV has become more serious because we have been so cautious for the last few years. I don’t know for sure if this is true, but it seems like a reasonable idea.
Long blood clots due to vaccines: Chris Martenson has a new video regarding the long blood clots that many embalmers have discovered in the arteries of COVID vaccine recipients. The phenomena started occurring in May of 2021, a few months after vaccination became common. Dr. Martenson is a pathologist and has done many autopsies in his career.
Chris Martenson on vaccine related blood clots:
In the video, he addresses a recently released documentary called “Died Suddenly”. The documentary claims that at least 140,000 people have died due to these vaccine induced blood clots. In Martenson’s video, he points out that detractors of the “Died Suddenly” film argue that these clots are post-mortem, meaning they arise after the person has died. Dr. Martenson argues that the clots in vaccinated patients are definitely pre-mortem (before death), not post-mortem as some have claimed. He gives specific features that lead him to this conclusion.
Dr. Martenson is one of my favorite commentators. He is knowledgeable, open-minded, and evidence based.
I got a question about whether these clots only happen in vaccinated people. Late stage COVID disease is well known to cause clotting. But COVID related blood clotting mostly cause strokes and thrombosis. Obviously, these can also be very serious and lead to death. The vaccine related clots are different, completely blocking vessels. It’s not yet known how large they are pre-mortem. Dr. Mortenson argues they are pre-mortem, but that doesn’t mean they won’t continue to grow before an autopsy.
Searching “COVID blood clot” and “vaccine blood clot” on Pubmed will both bring up a lot of papers. I haven’t read enough of these yet to know if the large clots only happen with vaccination. The fact that you don’t need to get COVID to have clotting is obviously very important.
Died Suddenly: Several people have asked my thoughts on this film. I will say that many COVID-era documentaries have a definite bias, so I always have my guard up when watching them. Claims without sufficient evidence are common.
The opening credits juxtapose images regarding blood clots and potential vaccine related deaths with images from other unproven theories, some that most regard as untrue or even ridiculous, like bigfoot and UFOs. This seems intentional, as if the makers intend for the viewer to pair these ideas. This seems to me to be ill-advised, if they intend to convince the viewer that blood clots can be tied to COVID vaccines. It almost begs the viewer to associate their thesis with nonsense.
The basic premise of the film, the phenomena of vaccine related clots, seems to be at this point to be well founded and well evidenced. The film offers several disturbing images of these clots being removed from cadavers. The film also shows many examples of individuals passing out suddenly, while driving, speaking in public, even performing surgery. The existence of this phenomena seems beyond dispute. Interestingly, the detractors Martenson references in his video claim that the clots are post-mortem, not that the clots don’t exist at all. Clotting has been a well known aspect of late stage COVID disease.
In addition to the potentially valid idea that vaccines have contributed to blood clotting in patients, the film makes the explosive claim that the deadly effects of the vaccine are actually intentional. I haven’t seen any data to suggest this connection. I’m not saying this is untrue, just that I haven’t seen evidence of this yet, so I don’t see a reason to believe it at this time.
The SARS-CoV-2 Spike protein has several toxic effects. First, it causes an inflammatory response in many tissue types in the body, leading to diverse symptoms, including myocarditis, inflammation of heart tissue. This new phenomena shows that the spike protein can also cause blood proteins like fibrin to form an amyloid, an unnatural collection of proteins. Amyloid plaques also have a role in Alzheimer’s disease.
Should you get the updated booster? COVID vaccines appeared to be working well in the Spring of 2021, but their effectiveness began to wane with the Delta variant. When Omicron became the dominant variant, vaccine effectiveness dropped even further. As knowledge of possible harms due to the spike protein has increased, I now think the harms of vaccination outweigh benefits in our current environment. In my opinion, there is no longer any reason to get a vaccine or booster, even for those with risk factors.
If you’ve been vaccinated, this information will likely cause you some concern. I don’t know how long vaccine related spike protein has the potential to cause injuries. Blood clots appear to form around 5 months after vaccination. If you haven’t been vaccinated or boosted in the last 7 months or so, you may be in the clear. I’m sorry I don’t know more.
I have to point out that official channels claim that the information in “Died Suddenly” has been de-bunked. When posting this information on Facebook, I was met with several warnings about posting. To be fully informed on this issue, you should read several sources of information and judge for yourself which are most reliable.
This is a COVID Update. I’ll also ponder again if we have entered the endemic phase of COVID.
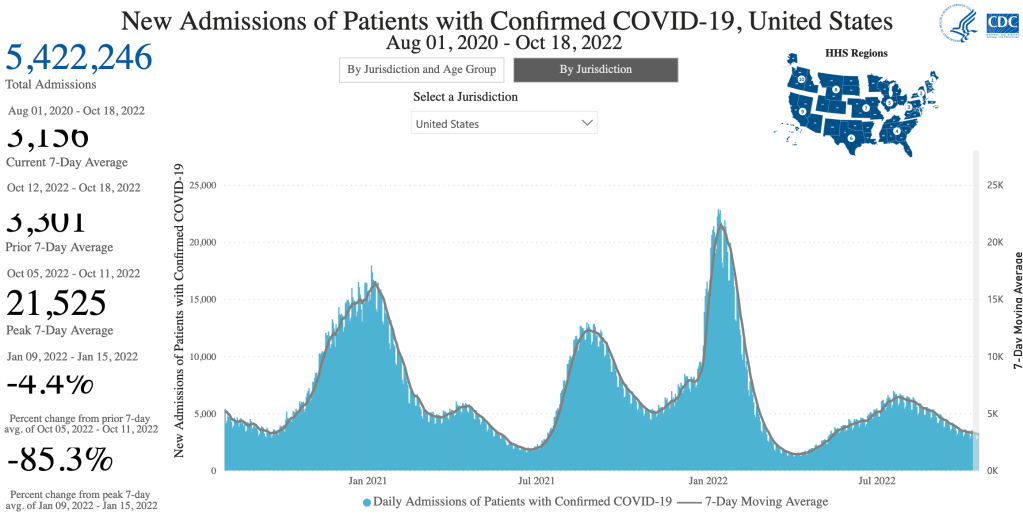
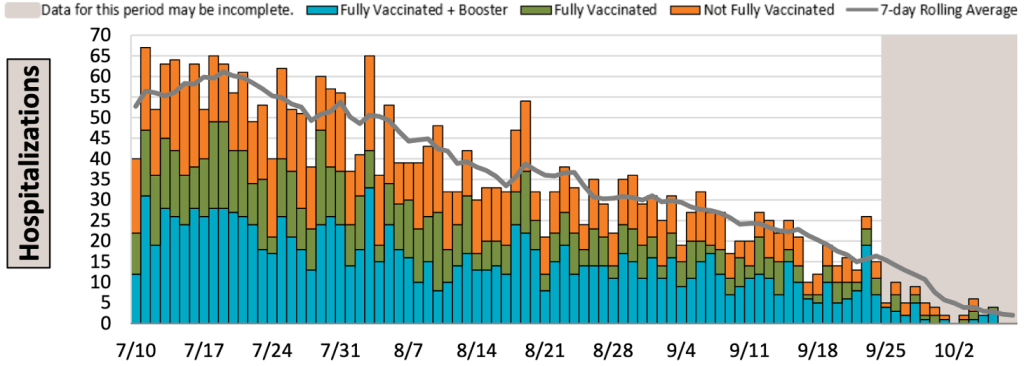
In the US, and San Diego County, case numbers are beginning to climb slightly, perhaps suggesting the start of a fall wave of new cases. California isn’t showing this trend yet. Hospitalizations are not rising for the time being, so all this means more people are entering the medical system with COVID, but this isn’t yet translating into more hospitalizations. So current cases are more mild and moderate than severe. This trend is new, so we may see this change later.
Graph is by me, from data collected from Johns Hopkins University COVID site. Graph is presented in a logarithmic format to emphasize small numbers. Note that each number on the left is 10x higher than the one below it.Graph is by me, from data collected from Johns Hopkins University COVID site. Graph is presented in a logarithmic format to emphasize small numbers. Note that each number on the left is 10x higher than the one below it.Hospitalizations, from the CDC website.Graph is by me, from data collected from Johns Hopkins University COVID site. Graph is presented in a logarithmic format to emphasize small numbers. Note that each number on the left is 10x higher than the one below it.Graph is by me, from data collected from Johns Hopkins University COVID site. Graph is presented in a linear format.Graph is by me, from data collected from San Diego County Public Health. Graph is presented in a logarithmic format to emphasize small numbers. San Diego County now only releases information on Thursday each week. Data points shown are extrapolated using this information.Graph is by me, from data collected from San Diego County Public Health. Graph is presented in a linear format. San Diego County now only releases information on Thursday each week. Data points shown are extrapolated using this information.Hospitalizations in SD County, July 10th to October 10, 2022. Gray area represents time-frame in which data is still being collected. Note that a significant number of hospitalizations are among the vaccinated.Graph is by me, from data collected from Johns Hopkins University COVID site. Graph is presented in a linear format.
Is COVID endemic yet? An epidemic is an outbreak in a larger region like a state, country or even continent. A pandemic is an outbreak that spans multiple continents. An outbreak becomes endemic when it becomes widespread in an area and is beyond control by disease prevention means. For example, flu and HIV are both endemic, a now permanent part of life in the world. Many people I have spoken to have believed that COVID has been endemic for a long time, and perhaps was always destined to be. I was optimistic for a long time, thinking that our immune systems would be able to eventually catch up with it and make it extinct. Unfortunately, I think I lost hope in that this week. Some of you are saying “what took you so long?” I get it. But I think it’s important to have good reasons for why we believe something.
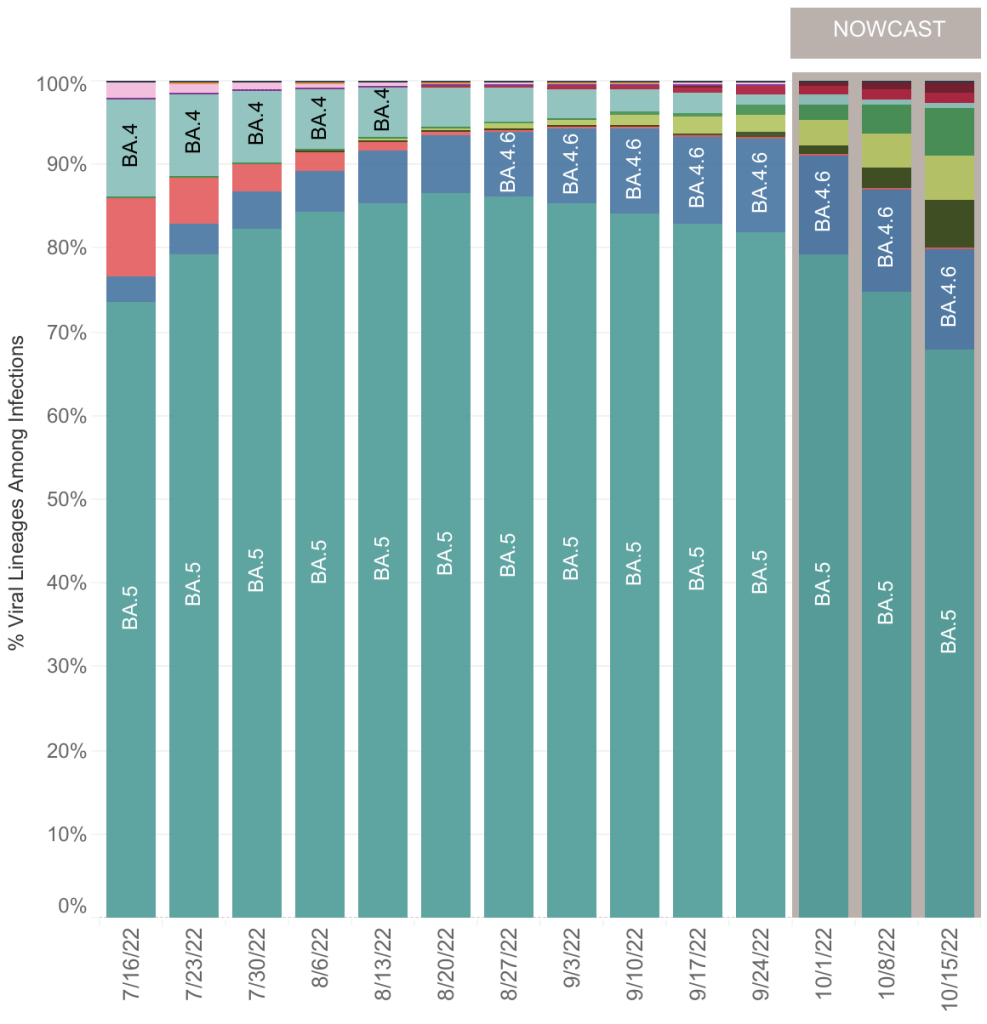
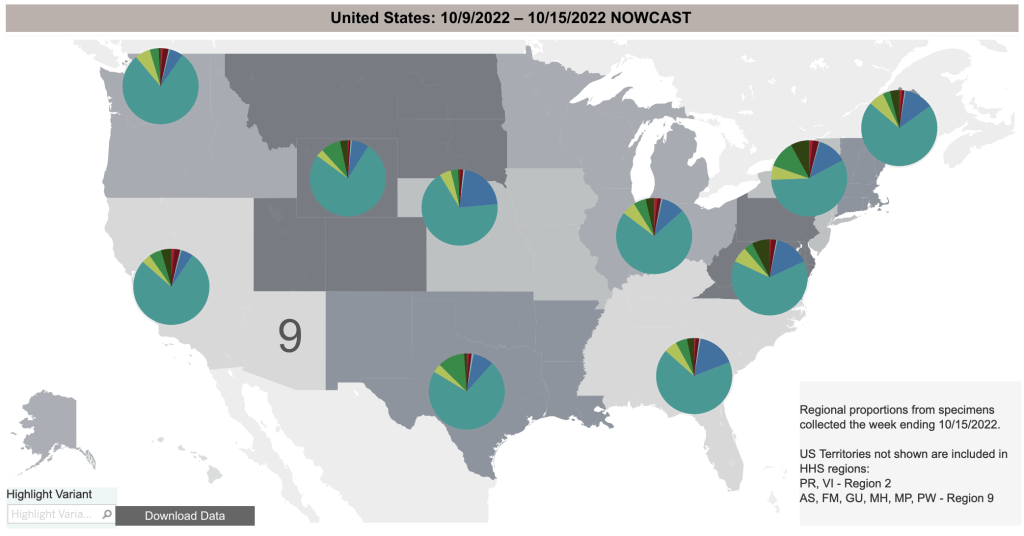
We have generally had single dominant COVID variant in each region, with a few less important versions going around too. In the US, we had Wuhan, then Alpha, Delta, Omicron, then Omicron BA.5. Currently, BA.5 has become a minority variant, with several others growing in prevalence. There is no single variant that dominates, and none are clearly growing faster than others. Importantly, new variants are arising more quickly that our collective immune system can keep up with them, and re-infections are now common. Happily, none of these new variants appear to be very pathogenic, and are not increasing the number of deaths, perhaps because natural immunity against COVID is becoming common.
From the CDC page on Variant Proportions for the United States. Updated on November 12th.From the CDC page on Variant Proportions for the United States. Updated on November 12th.
In light of all this, I’m becoming more convinced that COVID is now endemic, and we won’t get rid of it. Viruses have a tendency to become more infectious and less pathogenic (disease causing) over time, and we’ve certainly seen that happen during COVID. New COVID variants will likely continue this trend. So we most likely will never return to the days when there are very large numbers of COVID hospitalizations and deaths.
Fewer posts from me: During most of the pandemic, I posted every week. In the last few months, I’ve been posting only every 3 weeks or so. Because I believe COVID is now endemic, and most are only minimally concerned, I will probably be posting even less now, only when there is some significant COVID news.
Even though many think the pandemic is basically over in the US, there was still a ton of COVID news this last week. As usual, I’ll tell you what I’m going to talk about in the intro, and you can check the headlines down below to read what interests you. Some sections will be more detailed than many care about, and I have labeled those sections.
This is a COVID case update. I’ll also discuss yet more COVID variants, and a new paper from Greece about vaccines and inflammation. I’ll also discuss a preprint paper from Boston University in which they claim to have created a hybrid SARS-2 virus. Last, I’ll talk about a recent study which sheds some light on the number of people in the US who have actually had COVID as of February.
Case Update: Cases continue to go down in the US, California and San Diego County. This has been a steady trend since mid-July. Cases are about the same as in the Spring, before BA.5 arose. Despite several new variants, deaths have not had a new peak, and are still relatively low, but not as low as the Summer of 2021, before the Delta variant arose.
Graph is by me, from data collected from Johns Hopkins University COVID site. Graph is presented in a logarithmic format to emphasize small numbers. Note that each number on the left is 10x higher than the one below it.Graph is by me, from data collected from Johns Hopkins University COVID site. Graph is presented in a logarithmic format to emphasize small numbers. Note that each number on the left is 10x higher than the one below it.Graph is by me, from data collected from Johns Hopkins University COVID site. Graph is presented in a logarithmic format to emphasize small numbers. Note that each number on the left is 10x higher than the one below it.Graph is by me, from data collected from Johns Hopkins University COVID site. Graph is presented in a linear format. Graph is by me, from data collected from San Diego County Public Health. Graph is presented in a logarithmic format to emphasize small numbers. San Diego County now only releases information on Thursday each week. Data points shown are extrapolated using this information.Graph is by me, from data collected from San Diego County Public Health. Graph is presented in a linear format. San Diego County now only releases information on Thursday each week. Data points shown are extrapolated using this information.Hospitalizations in SD County, July 10th to October 10, 2022. Gray area represents time-frame in which data is still being collected. Note that a significant number of hospitalizations are among the vaccinated.Graph is by me, from data collected from Johns Hopkins University COVID site. Graph is presented in a linear format.
New variants: There are more new variants. They continue to follow the trend of being more infectious than previous versions. Some outlets are raising alarms about these new variants (BF.7, BQ.1, XBB), but there is not yet concrete evidence that they are more pathogenic than other recent versions. There was concern that BA.5 was truly more pathogenic than other Omicron versions, but it still didn’t produce a new wave in deaths, perhaps because so many Americans now have either vaccine or natural immunity. How many? See below!
From the CDC page on Variant Proportions for the United States. Updated on October 15th.From the CDC page on Variant Proportions for the United States. Updated on October 15th.From the CDC page on Variant Proportions for the United States, by region. Updated on October 15th.
Spike protein may contribute to adverse events: A July opinion paper from Greece claims that the Spike protein produced by vaccines cause inflammation and may be responsible for adverse events. The paper was published by Cell Press, one of the premiere science journal publishers.
If you’ve been reading my posts for a while, you will know that I first wrote about the link between the Spike protein and adverse events way back July of 2021. For many months, the idea that vaccines were causing a lot of adverse events, and that the Spike protein itself was toxic was considered misinformation by the American medical establishment, yes, even by me. Now this idea is becoming a topic of debate and perhaps even accepted.
If you look up the words “adverse events covid vaccine” on PubMed, the site biologists use to search scientific articles, you will now see dozens of papers linking vaccines, the spike protein, inflammation, and adverse events. Sorry, I still do not know just how many adverse events there are, as this information has not been adequately collected and/or shared by the CDC.
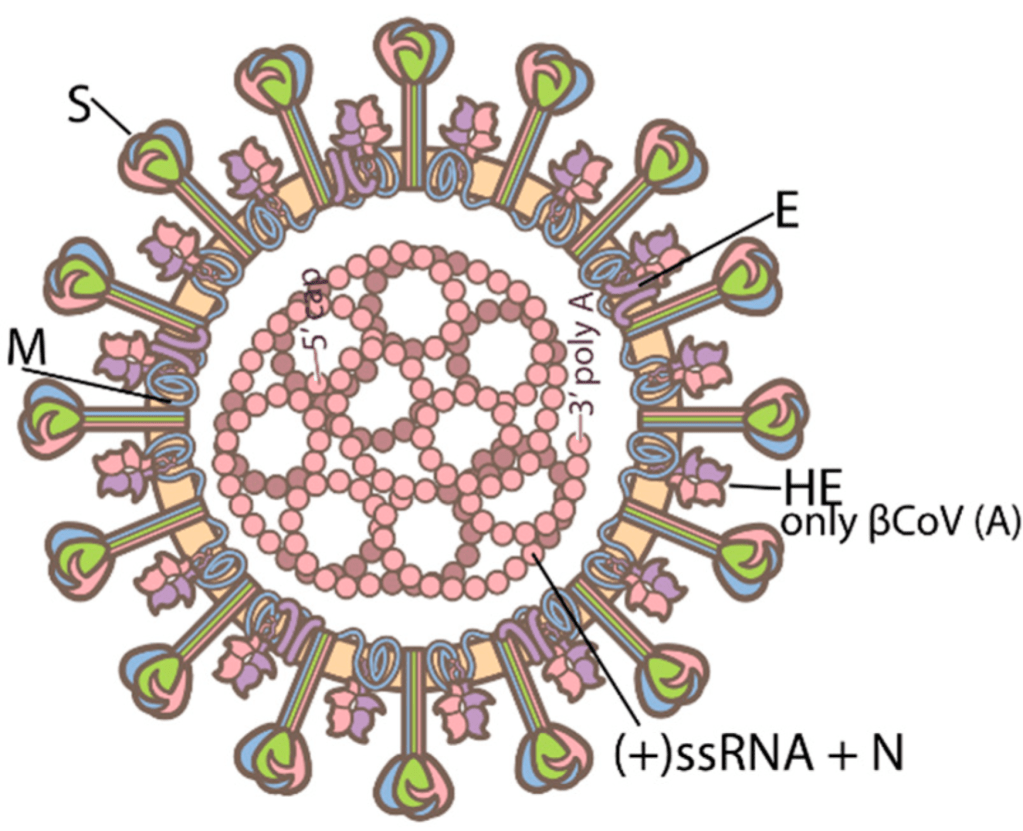
Details: Many scientists are now suggesting that the vaccine should have used the Nucleocapsid protein rather than the Spike protein. Nucleocapsid is a SARS-2 protein that helps package the RNA genome. It does not change as rapidly as the Spike protein and does not interact directly with human proteins, so is not toxic. For these reasons, it would have been safer to use the Nucleocapsid protein instead.
Structure of SARS-2. Spike is the tall outer protein, Nucleocapsid is the internal pink protein. From Sriwilaijaroen, N.; Suzuki, Y. Host Receptors of Influenza Viruses and Coronaviruses—Molecular Mechanisms of Recognition.
The downside is that a vaccine using Nucleocapsid would not have prevented initial infection. Why would it have been useful then? When the immune system destroys a virus, proteins from the virus end up getting displayed on the outside of cells, either infected cells, or immune cells. This gives the immune system a chance to either detect these viral proteins and use them or make antibodies, or as a signal that a cell is infected and needs to be destroyed.
If the Nucleocapsid protein were used in a vaccine, SARS-2 could still infect human cells, since Nucleocapsid is inside the virus where the immune system can’t see it. However, after a cell is infected, it displays Nucleocapsid on the outside. If a person is immunized, immune cells will detect these proteins and destroy the infected cell. While using Nucleocapsid in a vaccine wouldn’t prevent infection, it would probably greatly reduce viral load and symptoms.
Keep in mind that this is Monday morning quarterbacking. Scientists didn’t know that the Spike protein itself was toxic when they created the vaccines, and internal viral proteins aren’t generally used in vaccines, so it didn’t occur to anyone to do this at the time. It is being discussed now, though, and may change vaccine design in the future.
Of course, we all now know that the Spike vaccines did not prevent infection by the Delta and Omicron variants.
Hybrid SARS-2 Virus Created in the Lab: This Monday, a lab at Boston University reported that they had created a strain of SARS-2 virus that killed 80% of infected mice. The internet freaked out and subsequent reports said that it wasn’t all that bad, etc. So I wanted to discuss this paper, tell you want exactly they did, and what I think about it. There will be some detail, but I’ll give you a summary at the end if you want to skip to that.
The Boston group led by Mohsan Saeed took the Spike protein from an Omicron variant, and knitted it into the backbone of the original Wuhan virus. The goal was to see what made the Wuhan virus more pathogenic, and the Omicron virus less pathogenic. Was it the Spike protein, which determines transmissibility, or the internal viral proteins which determine other factors like how fast it replicates in a cell.
The resulting virus, called Omi-S was in fact much more pathogenic than Omicron, but not as pathogenic as the original Wuhan strain. In the now infamous 80% kill rate experiment, it is important to know that the mice were infected in a very efficient manner, so that they were likely to have a severe case. Also, the ancestral Wuhan strain killed 100% of these mice (6 mice died out of 6 mice tested). The Omicron strain killed 0%. So if Omi-S were to escape into the population, it wouldn’t kill 80% of the population, only 80% of the number that Wuhan killed. So if Wuhan killed 1 – 3% of victims, Omi-S might only kill 0.8 – 2.4%. Using several measures, Omi-S was much more pathogenic than Omicron, but less pathogenic than the Wuhan strain.
On the other hand, Omicron was well known to be much more transmissible than the Wuhan strain. Presently, even countries that did well early in the pandemic have been unable to control Omicron and have experienced big outbreaks this year. So it is likely that Omi-S could spread extremely rapidly, and still kill more people than the original Wuhan strain.
So was this result worth the risk? Most infectious disease scientists know that the 1918 flu was so dangerous not just because of its unique surface proteins, but also because the internal proteins were especially robust. The result with Omi-S paper shows much the same thing. To me, the paper gave a result which was unsurprising. Scientists will disagree on whether this new variant should have been created. In my view, it was not worth the risk to create such a potentially dangerous variant to get a “water is wet” result.
Does Omi-S still pose a threat? Experiments like this in the US are usually monitored by the CDC or other agencies. Labs are generally required to destroy dangerous agents when the experiment is over. It is likely that Omi-S no longer exists. But given the unintentional release of SARS-2 in the first place, I think Americans may feel justified in being a little nervous about these experiments.
As an aside, in many infectious disease experiments, scientists go through a lot of effort to create test viruses or bacteria that cannot survive outside the lab environment. They do this by making versions that are incomplete, or need to be provided specific nutrients to survive.
Summary of the Hybrid SARS-2 virus: The Boston lab created a virus that combined the internal workings of the more pathogenic Wuhan strain with the more transmissible Omicron Spike protein. They found that the internal proteins were likely responsible for the higher pathogenicity of the Wuhan strain. In light of what is known about the 1918 flu virus, this result is not surprising. While this hybrid virus likely no longer exists, my view is that the incremental knowledge gained was not worth the risk of creating this strain.
Headlines that the virus killed 80% of mice were true but misleading. Under the conditions of the experiment, 80% of mice were killed by the new virus, but 100% of mice were killed by the original Wuhan strain. So this virus would be approximately 80% as deadly in infected people as the Wuhan strain.
How many people have had SARS? The CDC published a paper in April describing “Seroprevalence” in the American population. “Seroprevalence” basically means the number of people who have antibodies for a particular virus. The study detected antibodies against the Nucleocapsid protein in patients between September 2021 and February 2022. They did not have a random sample of patients, but rather used lab samples gathered when the people tested went to the doctor for any reason. So the subjects were skewed to people who were sicker or otherwise more engaged with health care than others.
Because they detected antibodies against Nucleocapsid and not Spike, the study did not detect vaccinated people, only those who have had COVID. Interestingly, the results showed that 75% of children up to 11 have had COVID, and the number was lower in each higher age group. Of those 65 and older, only 33% have had COVID.
This post is about a new California law seeking to limit misinformation.
California’s Governor Gavin Newsom signed AB 2098 into law on Friday. The new law allows the Medical Board of California to punish health care providers for spreading misinformation. The law does this by adding the act of spreading misinformation to the definition of “unprofessional conduct” used by the Medical Board of California. Unprofessional conduct is punishable in California by up to the suspension or loss of a license to perform medicine.
The law defines “misinformation” as “false information that is contradicted by contemporary scientific consensus contrary to the standard of care.”
There are many, many examples of ideas in science and medicine that were opposed by the scientific consensus and later accepted as true. There are so many examples of this, that it should be considered as a normal part of the scientific process. Examples include:
The Earth revolves around the Sun
Not cleaning surgical tools between operations can lead to increased mortality in patients
Ulcers are caused by the bacteria H. pylori, not by spicy food
Viruses can cause cancer
Cells produce energy by passing electrons through a membrane
The universe began at a discrete moment, and then expanded to its current form, creating both space and time in the process
The SARS-2 virus was created in a laboratory in Wuhan*
The idea that misinformation can reasonably be defined as an idea that is contradicted by scientific consensus is itself contradicted by centuries of scientific practice.
Scientific ideas come to be seen as true not merely by achieving consensus, but also by surviving challenge by new ideas. No scientific idea is immune to this process. Science is not a set of facts set in stone, but a constantly changing set of ideas guided by the scientific process, a process which includes debate among scientists. Requiring that new ideas achieve consensus immediately would freeze the advance of science in place, the current, and often wrong, ideas remaining dominant forever.
Of course, I have not yet addressed the obvious First Amendment violation this new law creates. The First Amendment clearly allows freedom of speech, a cornerstone of American life. This law will quickly be challenged by First Amendment advocates and will almost certainly be struck down.
As I’ve stated before, freedom of speech is not the cause of misinformation. It is the antidote. Only if we allow the free flow of ideas can these 3 things happen:
All ideas to be aired Good ideas to be confirmed and adopted Bad ideas to be discredited
Dr. Mobeen Syed points out several other negative impacts this law will have:
Doctors will be suspicious of their patients, compromising the doctor/patient relationship.
Doctors will only give consensus advice, making going to the doctor more like going to a call center.
Laws will expand to include other kinds of “misinformation” further compromising the exchange of ideas.
Law will be used unequally to silence only certain kinds of speech.
Doctors may choose not to practice in California.
If I’m being too subtle, I’ll just say that this is a bad, unconstitutional law and should simply be ignored.
Don’t fear, but be smart, Erik
* I’m taking a little liberty on this one. This idea was rejected totally early in the pandemic. It is not yet universally recognized as true, but many scientists, including me, see it as most likely to be true.
_____________________________________________ Update: January 13, 2023
California Physician Misinformation Act: On October 4th, 2022, I wrote about California AB 2098. This new law went into effect on January 1st and adds “the dissemination of misinformation or disinformation related to the SARS-CoV-2 coronavirus” to the definition of unprofessional conduct for physicians in California. Unprofessional conduct can result in the suspension or loss of license for physicians in California.
Just yesterday, I had lunch with a friend of mine who is a doctor in California. I asked him how he is dealing with this new law. He said most of the doctors at his hospital follow the official guidance promoting vaccination, and the few who don’t have become very quiet about vaccines. Doctors can’t say anything negative about the vaccine, for the risk of their medical license.
In 2021, this same doctor was coerced into getting the vaccine to retain his position at the hospital. He got a booster later in the year. A month after receiving his booster, despite being very physically fit for his age, he had a heart attack. His cardiologist said he had none of the arterial plaques that typically cause heart attacks. My friend cannot prove this, but he strongly suspects that clotting due to the vaccine contributed to his heart attack. Despite all this, he does not feel at liberty in California to give information to patients that would reflect negatively on the vaccines.
Because this law is so new, I don’t yet know how it will be handled by the Medical Board of California. If they choose to ignore it, then doctors won’t be under threat. However, doctors and pharmacists have lost their licenses in the last few years for violating CDC guidelines, so the threat is a real one.
If you live in California, you cannot expect your doctor to give you their honest opinion about vaccines. This is literally illegal now. Consider writing your state senator or assemblymember and ask them to support the repeal of AB 2098.
The Repeal of the California Physician Misinformation Act: Last October, I wrote about a new California law which made “misinformation” a cause for physicians in California to lose their medical license. Misinformation was defined as “false information that is contradicted by contemporary scientific consensus contrary to the standard of care.” As I argued, it is common for new scientific ideas to be opposed by the majority of scientists before gaining acceptance.
The new law immediately became a target of legal action, one case being Høeg vs Newsom. On September 29th, 2023, Høeg’s attorney filed a request that the law be permanently barred from enforcement. Just a few days later, on October 1st, California Governor Gavin Newsom signed a repeal of the law. This is great news for California physicians and patients. California physicians are again free to communicate to their patients without fear of losing their license. This is also great news for the cause of freedom of speech in the US.
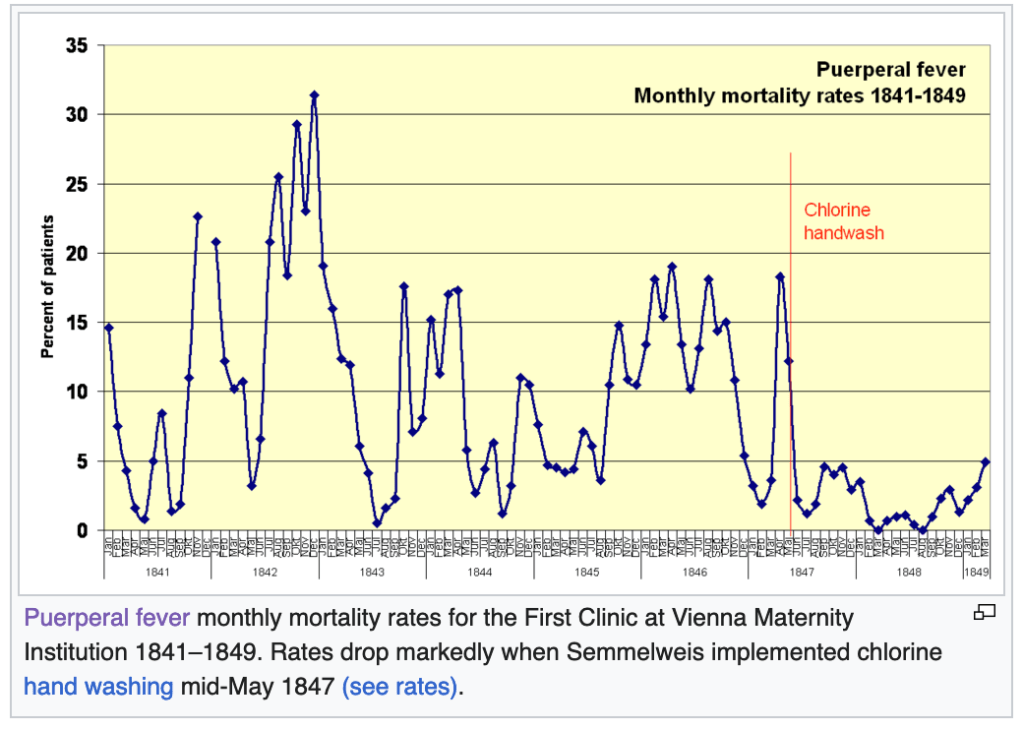
The fascinating yet tragic case of Dr. Ignaz Semmelweis:Ignaz Semmelweis was a physician at Vienna General Hospital in 1847. One of his jobs was to deliver babies in the maternity ward. Unfortunately, in his ward, the rate of fatality for new mothers was high, an average of 18.3%. Women were afraid to deliver in his hospital, and begged to deliver somewhere else!
Then one day, a colleague of Dr. Semmelweis died of Puerperal Fever, with symptoms very similar to the women in the maternity ward. His colleague had nicked himself with a scalpel while performing an autopsy on a cadaver. Dr. Semmelweis thought that maybe the fatalities in the maternity ward had something to do with the fact that Doctors where going straight from performing autopsies to delivering babies!
At this point, you’re probably holding your head and saying “What!?”, perhaps with some other colorful words added in. It’s obvious to us now that this was a terrible idea, but the Germ Theory of Disease had not yet been accepted in medicine. The field at that time had no idea that microscopic organisms could transmit disease.
Dr. Semmelweis started having physicians wash their hands in a chlorine solution after performing autopsies. The maternal death rate fell immediately to below 5%, some months having zero deaths. Dr. Semmelweis tried to tell others of his findings, but no one believed him. After increasingly passionate and ultimately embarrassing behavior, his friends and family had him committed to a mental institution. He was abused by guards and died in 1865.
That same decade, Louis Pasteur and Robert Koch were producing evidence supporting the Germ Theory, and Joseph Lister began popularizing the use of anti-septic procedures in surgery, greatly improving outcomes for surgical patients. Semmelweis’ ideas would be vindicated, but not until after his tragic death.
Semmelweis is now considered a hero of modern medicine, having a university, several hospitals, and even a minor planet named after him.
Why did I tell this story? Under a law similar to the California Physician Misinformation Act, people like Semmelweis would have lost their licenses. Semmelweis’ story underscores the need for strict adherence to the Scientific Method, not the suppression of “misinformation.” We suppress unpopular ideas at our peril.
This is a case update. I’ll also comment on new variant, new boosters, and the President’s announcement that the pandemic is over.
Cases continue to go down in the US, California and San Diego County. Again, since most people are now testing themselves using over the counter tests, the official case numbers are probably a gross underestimation of actual cases. Hospitalizations are a better measure, and they are also going down.
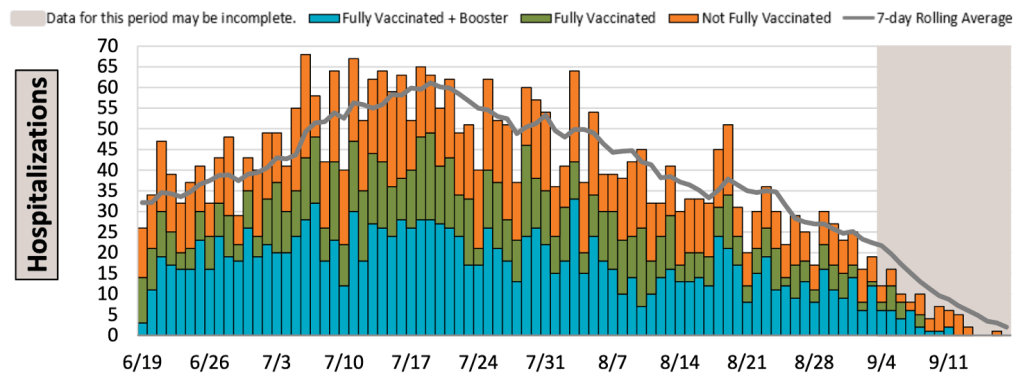
Graph is by me, from data collected from Johns Hopkins University COVID site. Graph is presented in a logarithmic format to emphasize small numbers. Note that each number on the left is 10x higher than the one below it.Graph is by me, from data collected from Johns Hopkins University COVID site. Graph is presented in a logarithmic format to emphasize small numbers. Note that each number on the left is 10x higher than the one below it.Hospitalizations, from the CDC website.Graph is by me, from data collected from Johns Hopkins University COVID site. Graph is presented in a logarithmic format to emphasize small numbers. Note that each number on the left is 10x higher than the one below it.Graph is by me, from data collected from Johns Hopkins University COVID site. Graph is presented in a logarithmic format to emphasize small numbers. Note that each number on the left is 10x higher than the one below it.Graph is by me, from data collected from San Diego County Public Health. Graph is presented in a logarithmic format to emphasize small numbers. San Diego County now only releases information on Thursday each week. Data points shown are extrapolated using this information.Graph is by me, from data collected from San Diego County Public Health. Graph is presented in a linear format. San Diego County now only releases information on Thursday each week. Data points shown are extrapolated using this information.Hospitalizations in SD County, June 19th to September 14, 2022. Gray area represents time-frame in which data is still being collected. Note that a significant number of hospitalizations are among the vaccinated.
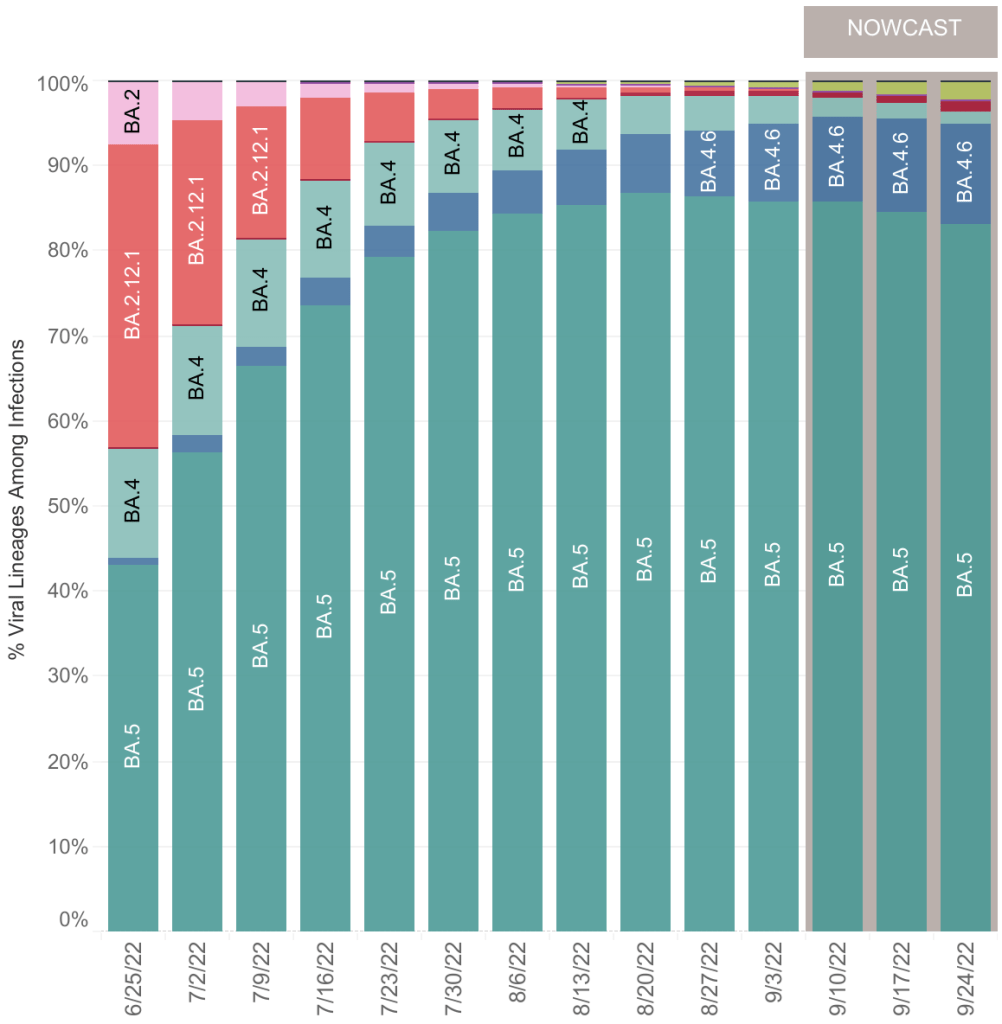
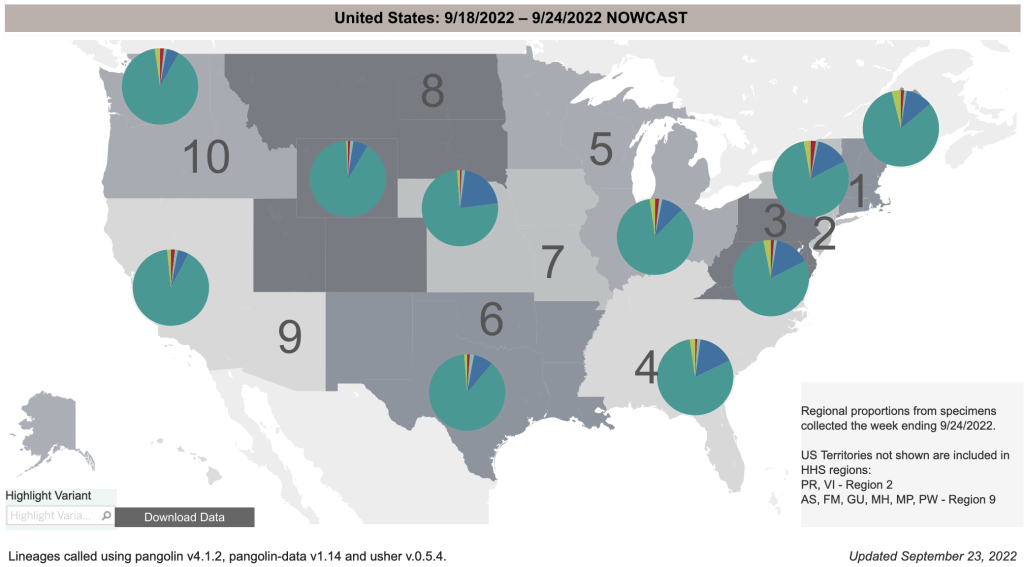
Variants BA.4.6 and BF.7: In my last post, I introduced a new variant BA.4.6. While hospitalizations are down, this new variant is now 11% of COVID cases in the US, and 20% of cases in the Midwest. Still, I don’t think this new variant is likely to have a big impact on the pandemic at the moment, and I expect cases to continue to go down. Deaths remain relatively low compared to the Omicron variant in April after the Winter wave. A newer variant, BF.7, is already growing in prevalence, but so far, there isn’t a lot of news about it.
From the CDC page on Variant Proportions for the United States. Updated on September 24th.From the CDC page on Variant Proportions. Updated on September 24th. Notice that BA.4.6 (dark blue wedge) is most prominent in the Midwest.From the CDC page on Variant Proportions for the Midwest. Updated on September 24th.
New boosters including Omicron strains: In August, the FDA announced emergency authorization of new boosters by Pfizer, Moderna, and Novavax. This new class of boosters produces spike proteins from the original Wuhan strain, but also from Omicron variants BA.4 and BA.5. People have been asking me my opinion about these new boosters. To preface my comments, I’ll say again that I am not a physician, epidemiologist, or immunologist, so my opinion is informed but not expert.
While the inclusion of BA.4 and BA.5 targets will make these new boosters an improvement over previous versions, I think most people will not benefit from them. For anyone who has had COVID, which is now arguably most of us, they will not really benefit you. Natural immunity has been shown in many studies to be equal or superior to vaccine mediated immunity in preventing infection and severe disease.
If you have never had COVID, you may benefit from the new booster. Keep in mind however that we have never really gotten clear data about adverse events after vaccination. In fact, Pfizer documents suggest that adverse events have been much more numerous than have been officially acknowledged. The new boosters have not yet been FDA cleared, and according to a video by John Campbell, Pfizer’s testing only included eight mice in their testing group. No human testing has yet been performed. Because variants are arising so quickly these days, I think the usefulness of new boosters is effectively over.
I suggested that my own parents get vaccinated in the Spring of 2021. But I am not suggesting that they receive the new booster. If you do choose to get the new booster, try and find a provider who will aspirate before injection.
President Biden announces that the pandemic is over: On September 19, CBS News released a video in which President Biden stated that the pandemic is over. In the interview, the President said “The pandemic is over. We still have a problem with COVID. We’re still doing a lotta work on it. … But the pandemic is over.” Of course, this triggered a debate on whether the pandemic is really over. At least a few health care officials said the health crisis is still ongoing, and that caution is still warranted. Debates are now ongoing as to the appropriateness of ongoing emergency measures like vaccine mandates and emergency use authorizations.
As for me personally, I had difficult time with COVID in January, and a much more mild case in July. I am basically behaving normally at this point. Most places I go, even in California, are basically going back to normal.
On other hand, hospitals are still seeing COVID patients and laboratories are still doing lots of COVID testing, so for them, COVID is still a reality they have to deal with.
If you’ve never had COVID, I would still recommend wearing a high quality medical respirator indoors in public (N95, KN95, or KF94). Blue surgical and cloth masks are not effective against Omicron variants.