Originally posted April 20th, 2020 on Facebook
Friends,
Mark Rasmussen sent me a link today that you’ll be interest in. It’s a new site that tracks the Effective Reproduction Number, Rt.
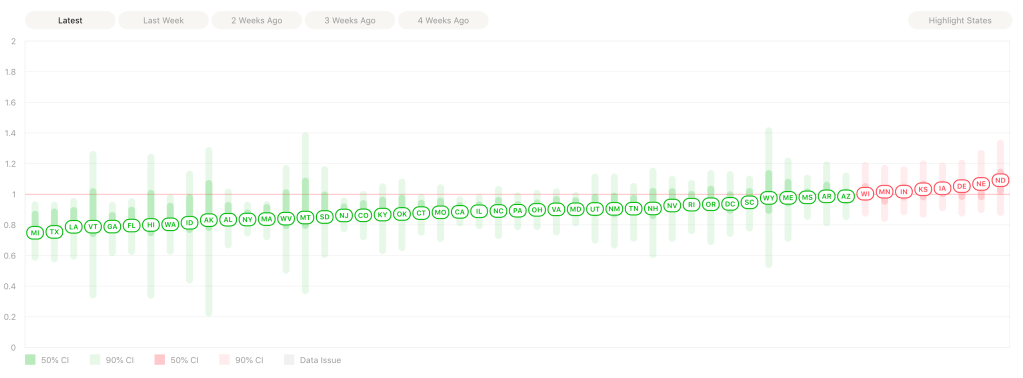
Ro, which we’ve talked about before, is a measure of infectiousness, and is the average number of people that a person would pass a virus to in it’s natural state, in a completely naïve population, and with no counter measures. For SARS-2, this number is 5.7. Rt is similar, but takes into account the measures we have taken to counter it. The Ro doesn’t change, but Rt does. The site shows the current Rt for every US state, and also shows a graph of Rt over time. Above 1.0 is bad, because that means each person is spreading the virus to at least 1 other person. Below 1.0 is good, and means the number of infected people is beginning to go down in that state. And yes, this is for confirmed cases only. There are more. We can only graph what we have information on.
The results are very interesting. For California, the state was below 1.0 for a few days, but as of April 20th, has climbed back up. This pattern is true of several states on the site, It appears many states started to climb as good news was coming out last weekend! Apparently people started feeling confident, and were less careful. An alternate explanation is that as testing is done on broader range of people, more cases are found.
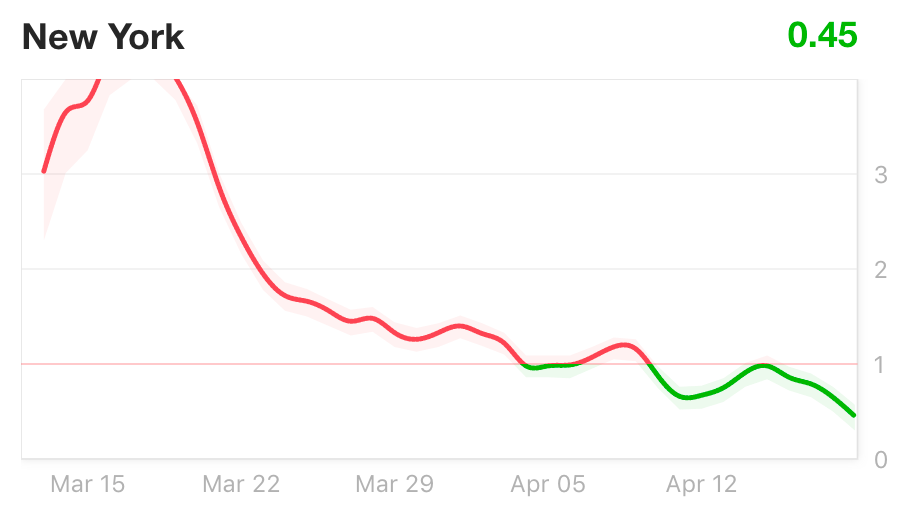
As we discussed before, New York state has had a very rough start, with more confirmed cases than any other state, and indeed more than any other country, except perhaps China. Recently, however, they’ve done much better, and have had an Ro below 1.0 since April 10th or so.
Using this site, you can see how your state is doing, and we can watch almost in real time, how the reopening process is affecting each state. This will really help us find the right approach.
Erik