Case Update: July 28th, 2020

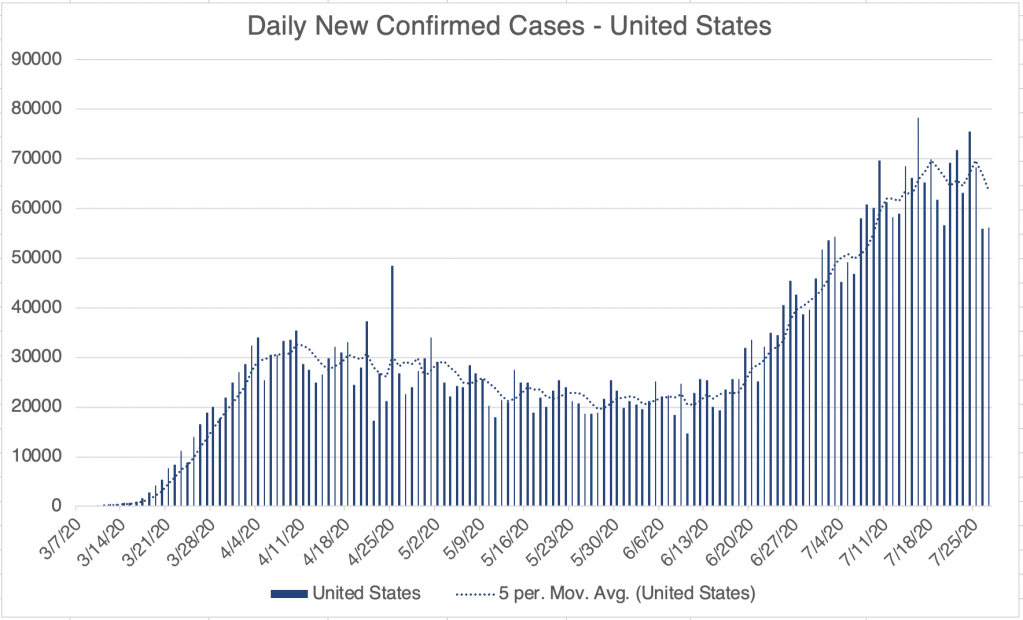
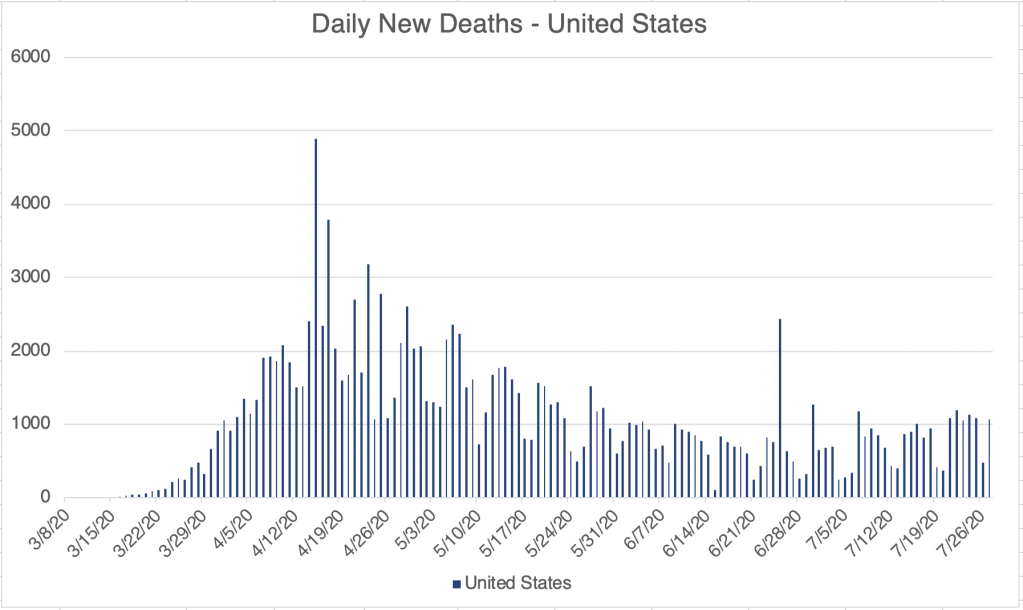
Some more good news this week.  The United States has unambiguously reached the peak of wave 1b, and daily new confirmed cases are slowly going down.  Daily deaths have risen slightly, trailing the higher new cases by a few weeks, but are still relatively low.  

Graph is by me, from data collected from Johns Hopkins University COVID site.

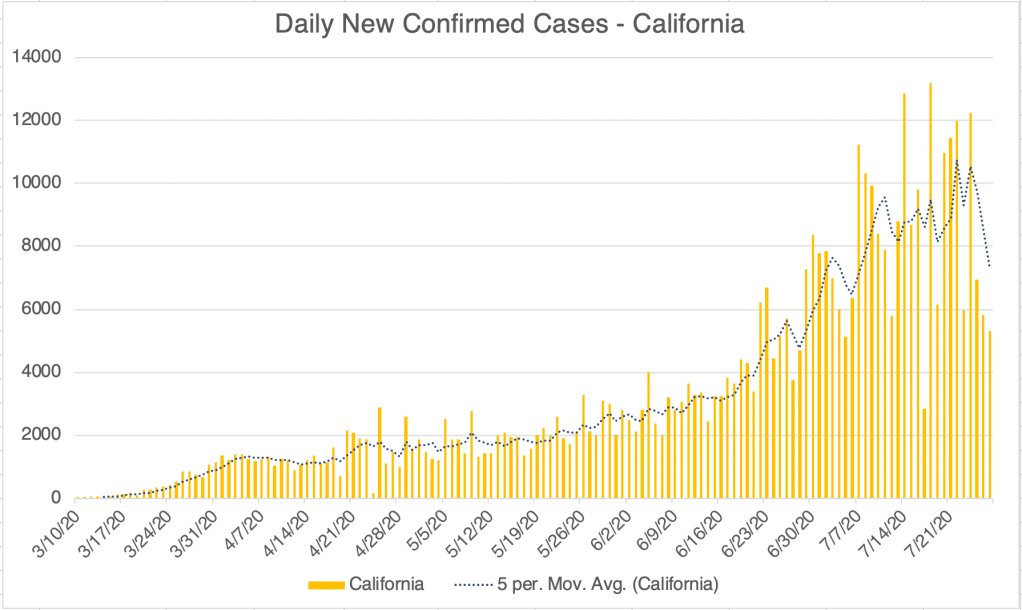
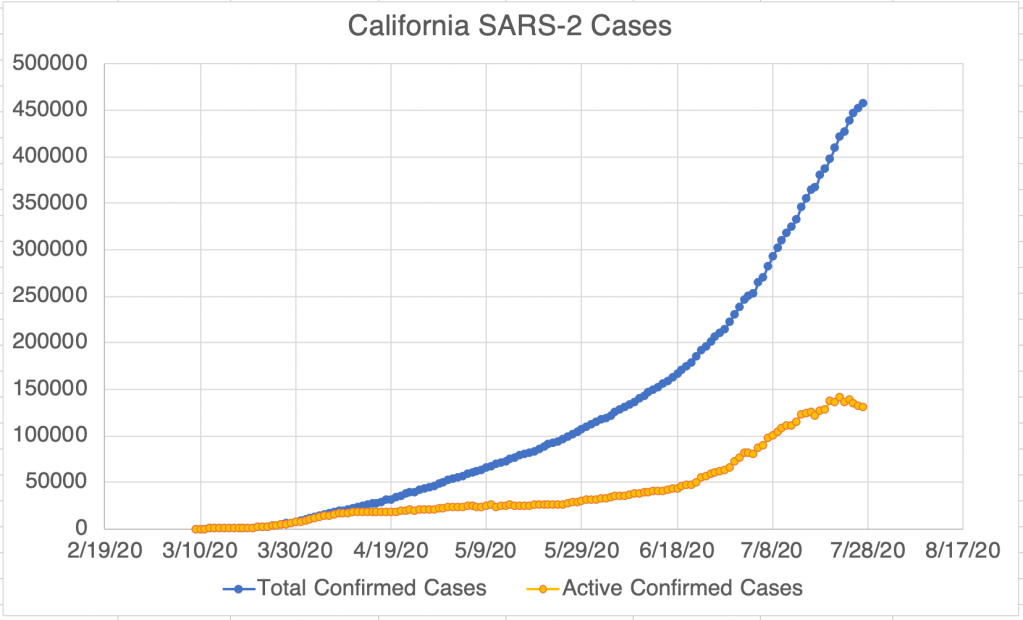
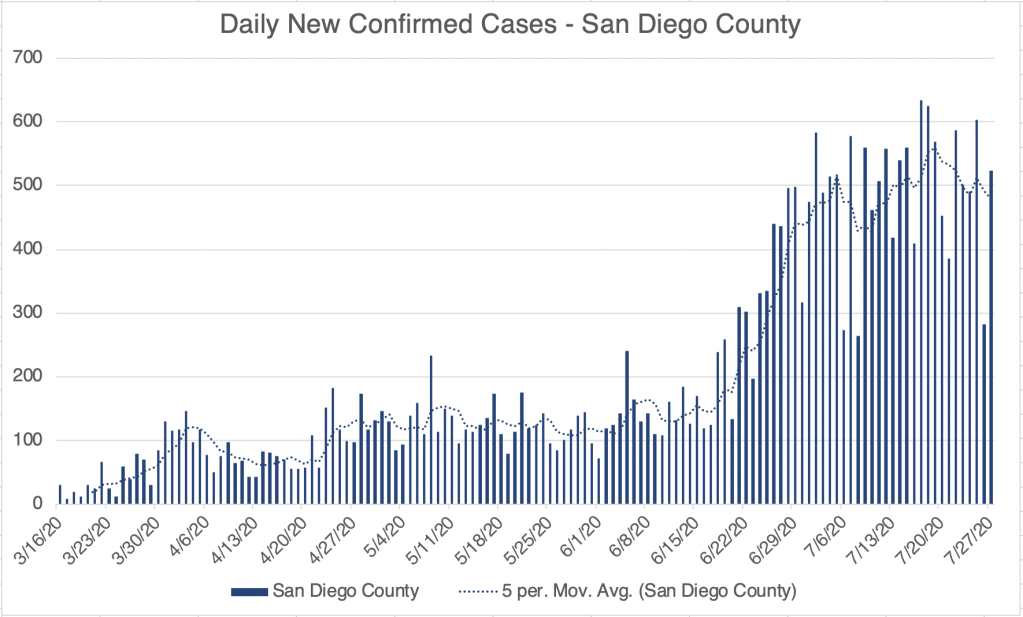
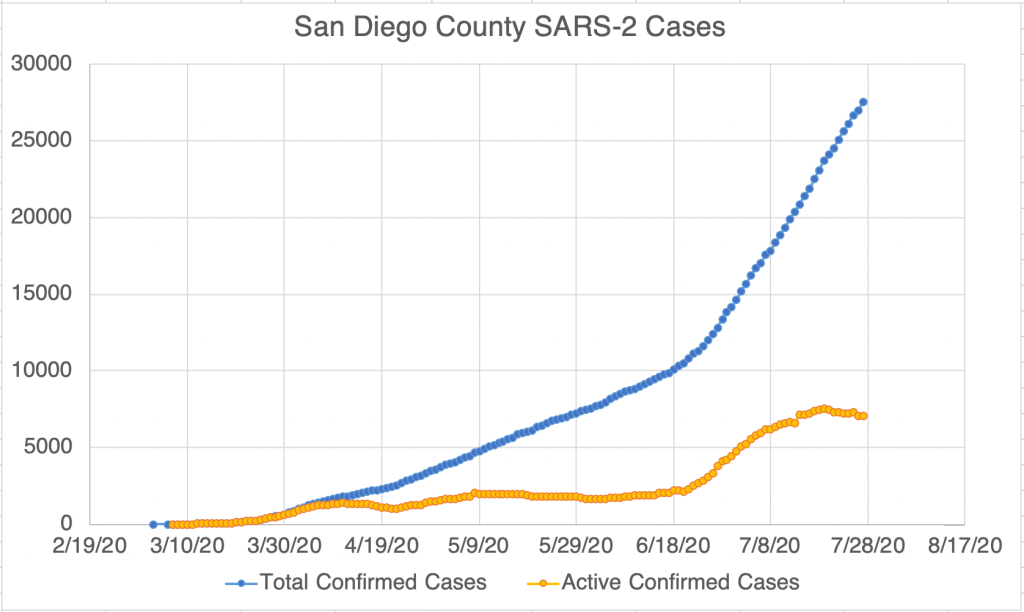
The situation is much the same in California and San Diego, with new daily cases coming down and daily deaths rising slightly.  Active cases are probably starting to go down as well.

Graph is by me, from data collected from Johns Hopkins University COVID site.
Graph is by me, from data collected from Johns Hopkins University COVID site. “Active Confirmed Cases” numbers are calculated based on the assumption that patients confirmed to have SARS-2 virus at least 17 days ago have recovered.
Graph is by me, from data collected from San Diego County Public Health. See also regularly updated slides from SD County.
Graph is by me, from data collected from San Diego County Public Health. See also regularly updated slides from SD County. Some data points of “Active Confirmed Cases” are from SD County, others are calculated.

Testing continues to rise and it is having some impact on the increasing confirmed numbers.  The higher testing is definitely a positive thing and will help us get a more accurate picture of what’s going on.

Don’t fear, but be smart,
Erik

1 thought on “Case Update: July 28th, 2020

Leave a Reply

Fill in your details below or click an icon to log in:

WordPress.com Logo

You are commenting using your WordPress.com account. Log Out /  Change )

Facebook photo

You are commenting using your Facebook account. Log Out /  Change )

Connecting to %s