Friends,
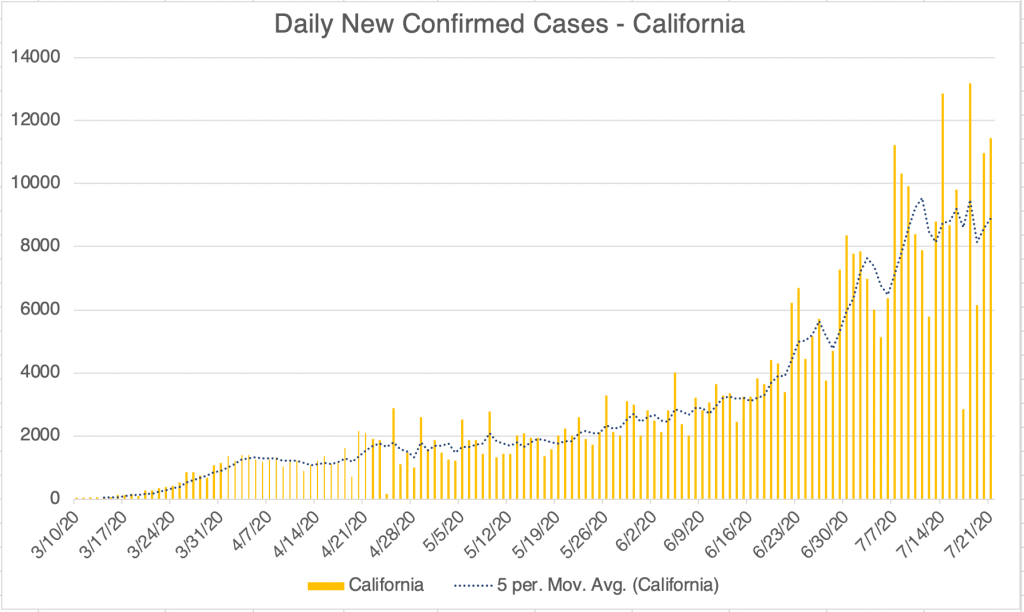
Happily, there is some good news about the virus this week. For the US and California, the number of daily new cases suggests that for both regions, we may have hit a peak in new cases. Sunday or Monday is always the low number for the week, but the number of new cases on those days usually predicts the peak for the rest of the week. For both, this week’s low is near or below last week’s low, suggesting that the high for the week will be near or lower than the high for last week.

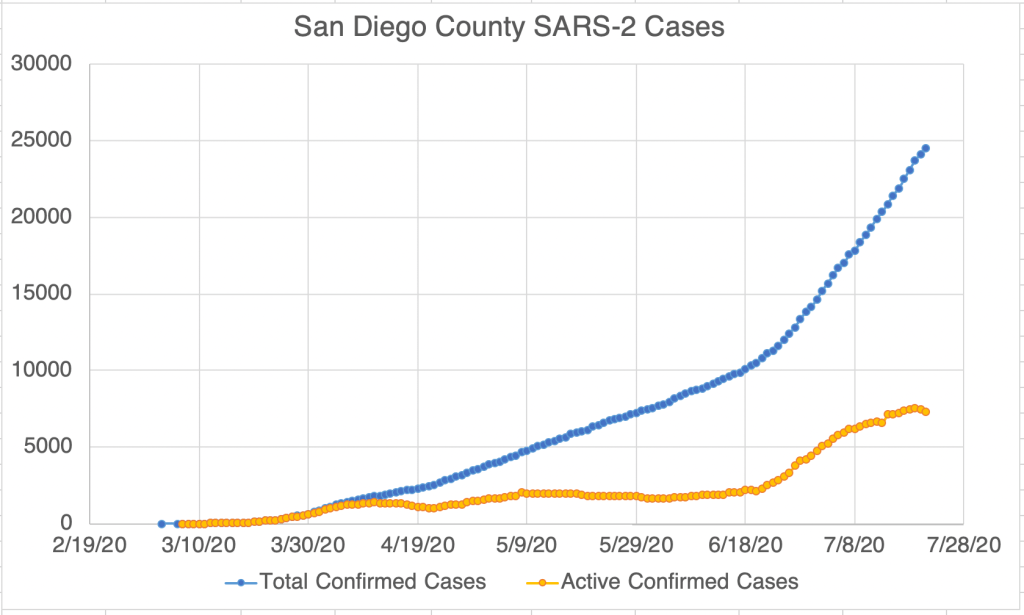
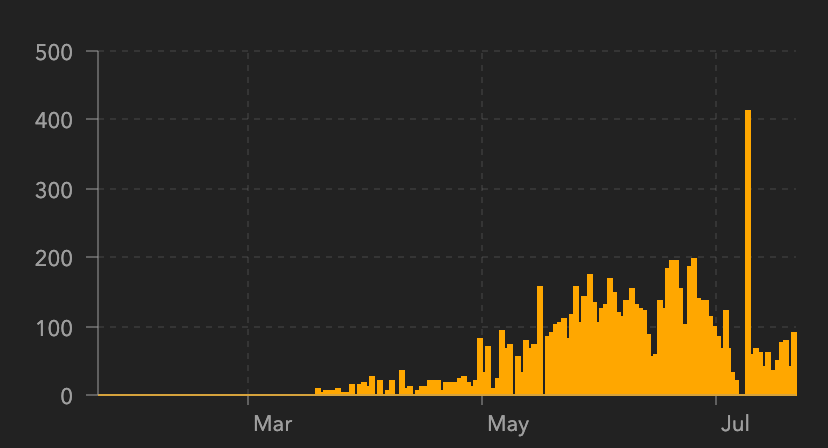
San Diego has been flat since early July. New cases aren’t going down yet, but they aren’t going up anymore either. In addition, the number of active cases in San Diego is probably going down, after a peak of almost 8000 active cases. Unfortunately, California overtook New York for the number of confirmed cases in the country this week, and LA County has the most new cases in the entire country, and has 40% of confirmed cases in California.

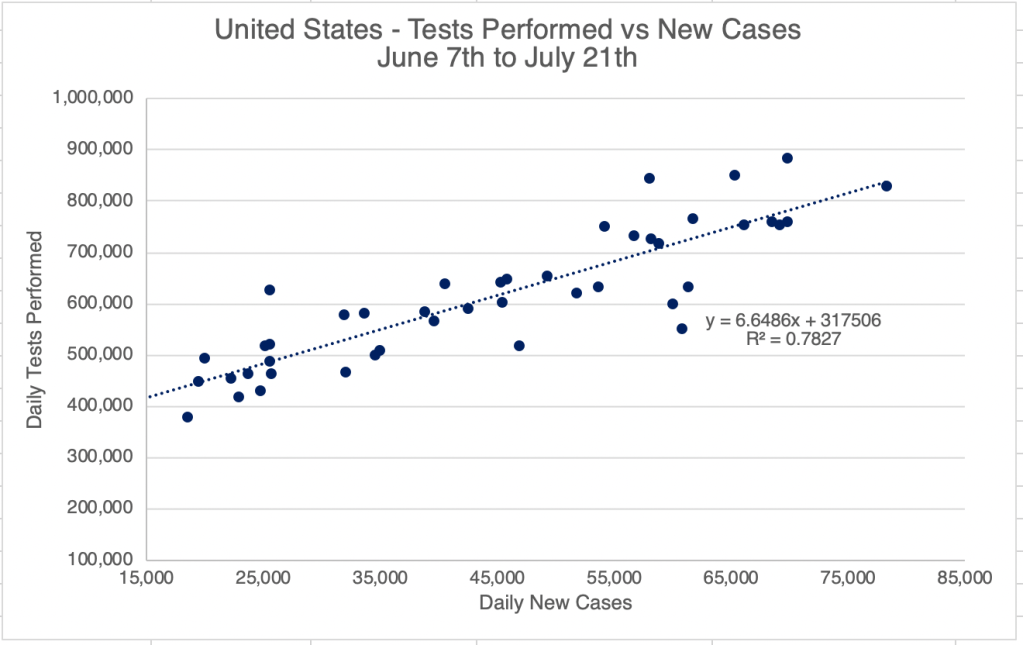
As we discussed in May 12th post on new cases, comparing the number of tests and new cases can tell us if all the new cases are just related to new testing. An R2 number between 0.95 and 1.00 shows strong correlation, “proof” that two things are related. The tests vs cases for the US since early July give an R2 of 0.78. This suggests that though many of the cases are real, at least some are because of new testing. In California the R2 is 0.44, a much weaker relationship, meaning more of the new cases are not just due to more testing.

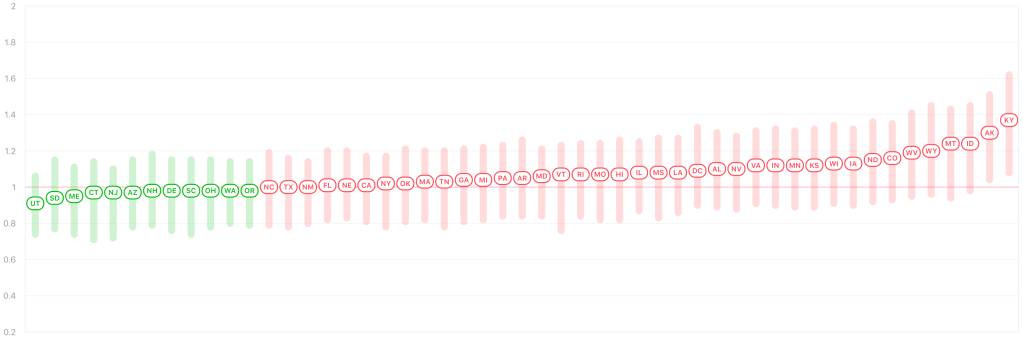
Rt Live shows that more states have an Rt number of less than 1.0, indicating that the virus is slowly going away in that state.
I have some African readers, so I’ll point out that the number of new cases appears to have peaked in Nigeria, DR Congo, Malawi, and South Africa, as well as in Brazil, a country which now has the 2nd highest number of confirmed cases, behind the US. Let’s hope we can keep this progress going!

Don’t fear, but be smart!
Erik
