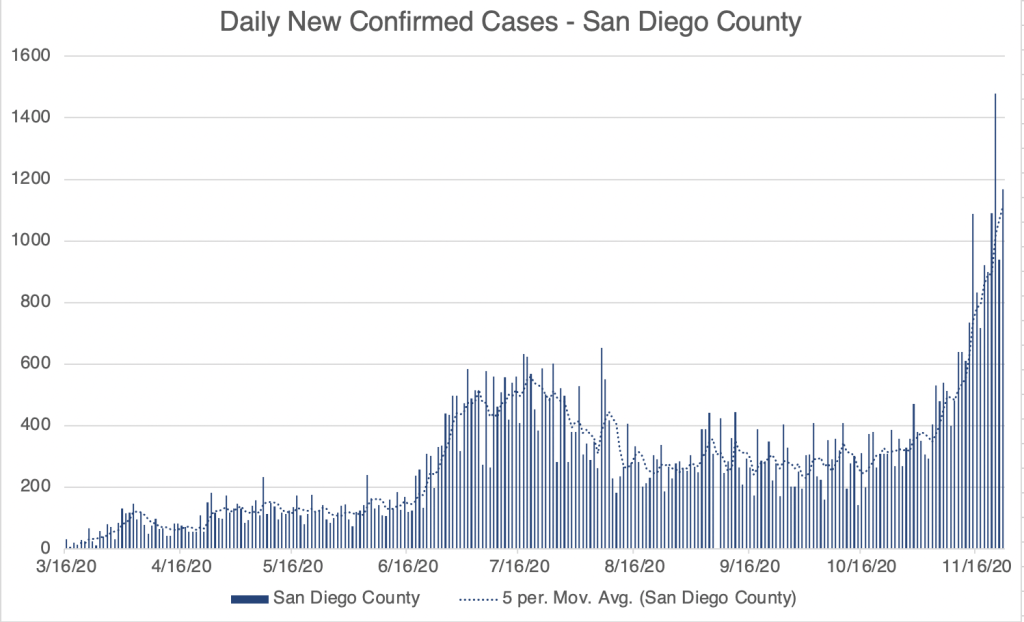
This is a case update. We are continuing to see a rise in cases for the US, California, and San Diego County. However, there is a glimmer of hope. If you look carefully at the graph for the US (or just look at the red arrows), you’ll see that this Sunday’s new confirmed case number is very close to last week’s.

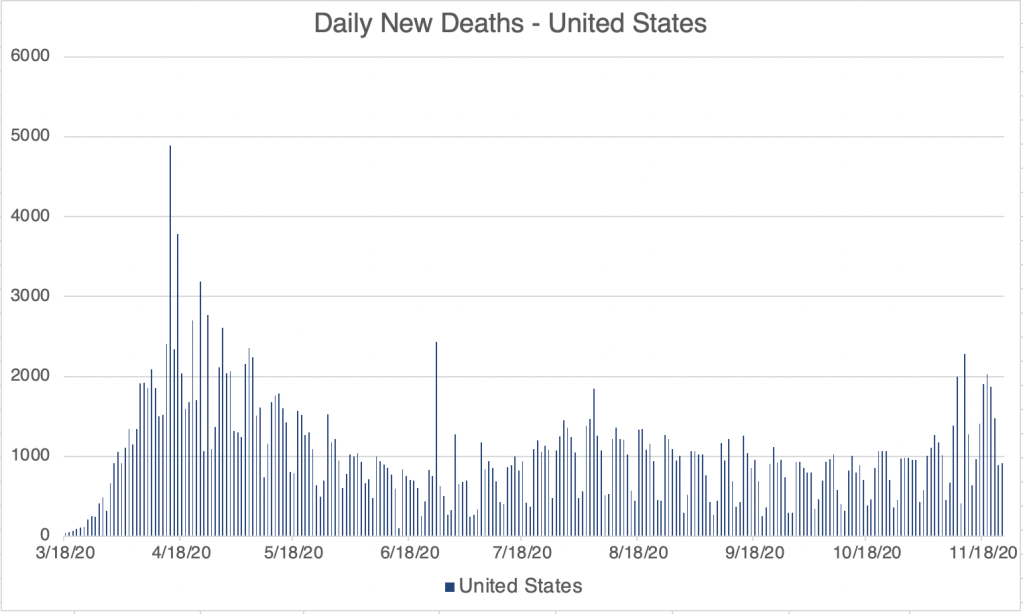
With numbers varying so much every day, it can be hard to see trends. But I noticed some time ago the Sunday consistently had the lowest new case numbers of the week. If a Sunday’s number was higher than the previous Sunday’s number, we would have a bad week, but if it was lower, things were getting a little better. After several weeks of steadily increasing case numbers, Sunday number suggests that we may have reached the peak of the 3rd wave. Of course, this may not pan out, and I may be apologizing later for misleading you, but it looks good right now. Also, lots of extra people are getting tested right now before Thanksgiving, which will also add to the numbers for this week.
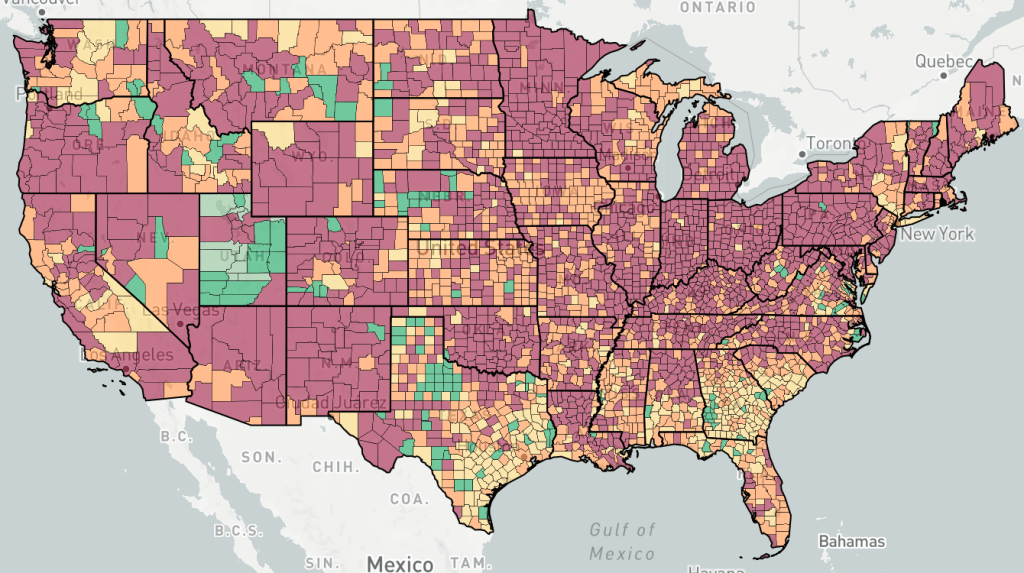
Also notice a few more orange counties in the northern states on the map of US counties. These are likely counties where things are improving. Peaks of new cases are moving south however.

So we can be optimistic while still working toward the end of the 3rd wave!
Don’t fear, but be smart!
Erik
