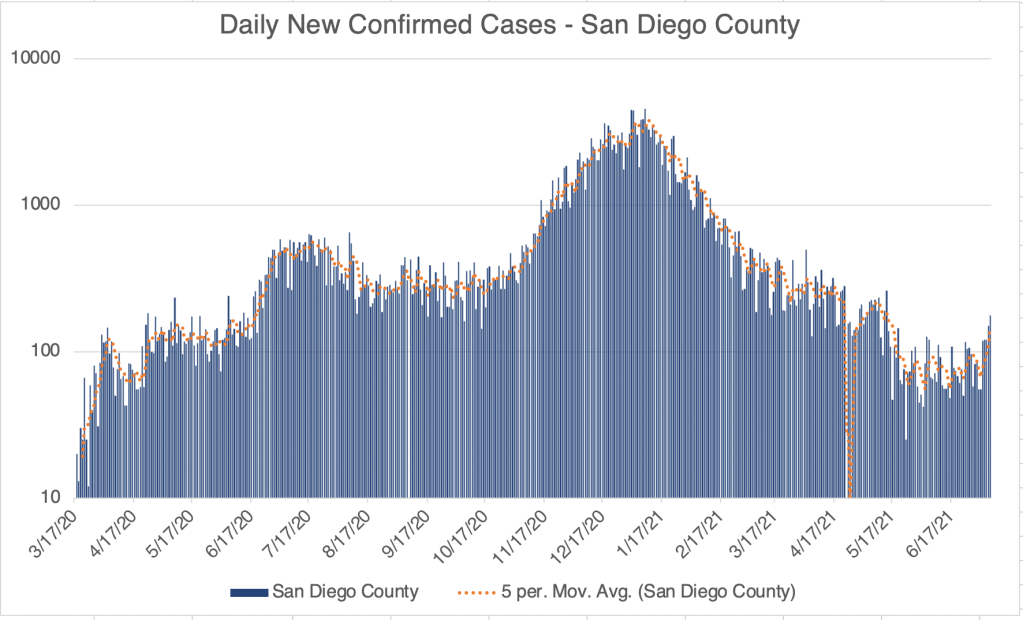
This is a case update. Reporting has become erratic in the last few weeks. San Diego County in particular only reports new numbers on Wednesdays now, so we are no longer getting daily new numbers. Also, Johns Hopkins is no longer reporting Recovered Cases, so I can no longer give Active Cases. These disclaimers aside, there has been an increase in cases in the last few weeks. This is almost certainly because of the more infectious Delta/India variant.
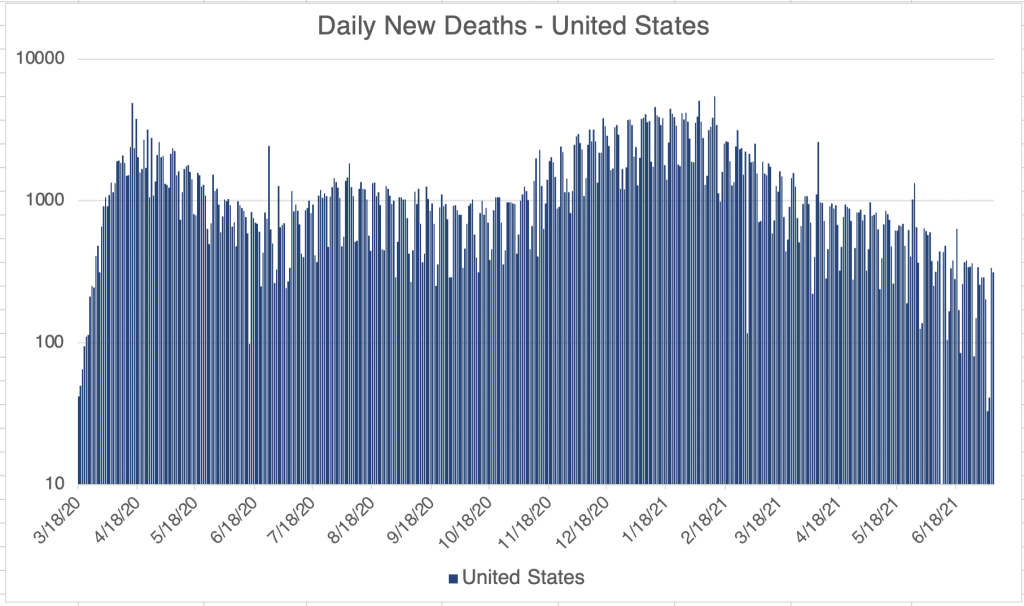
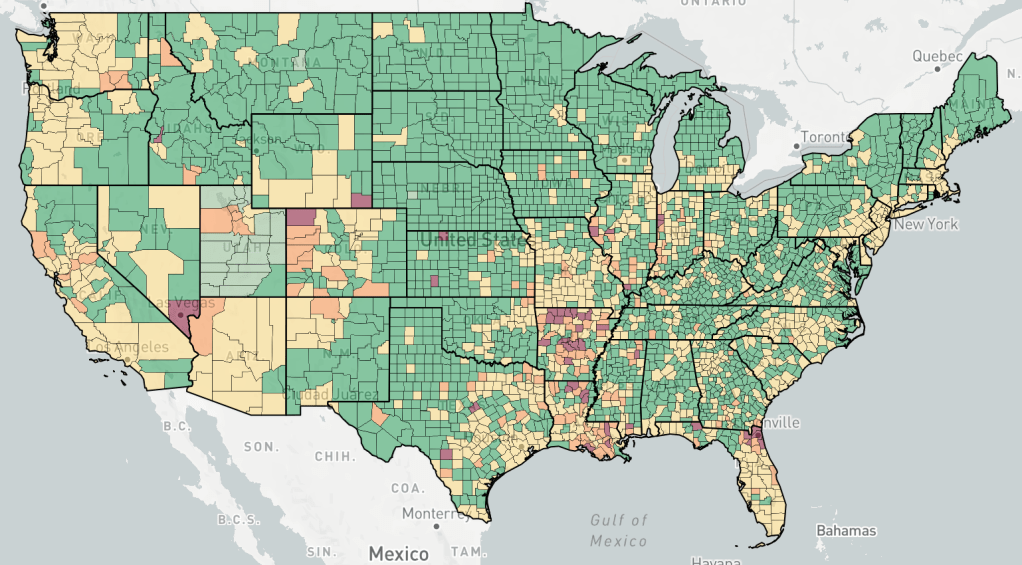
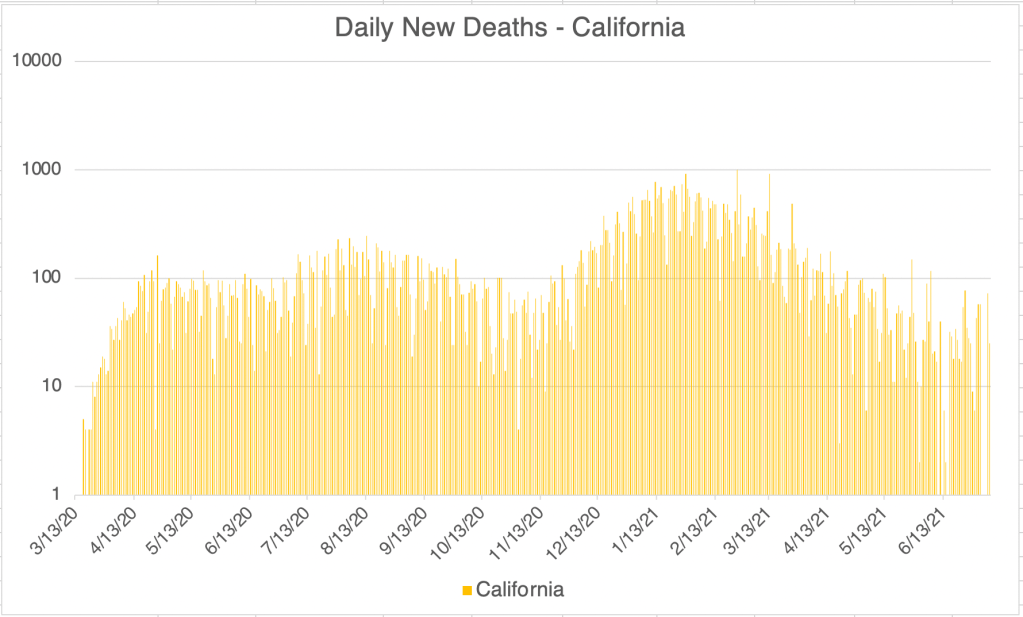
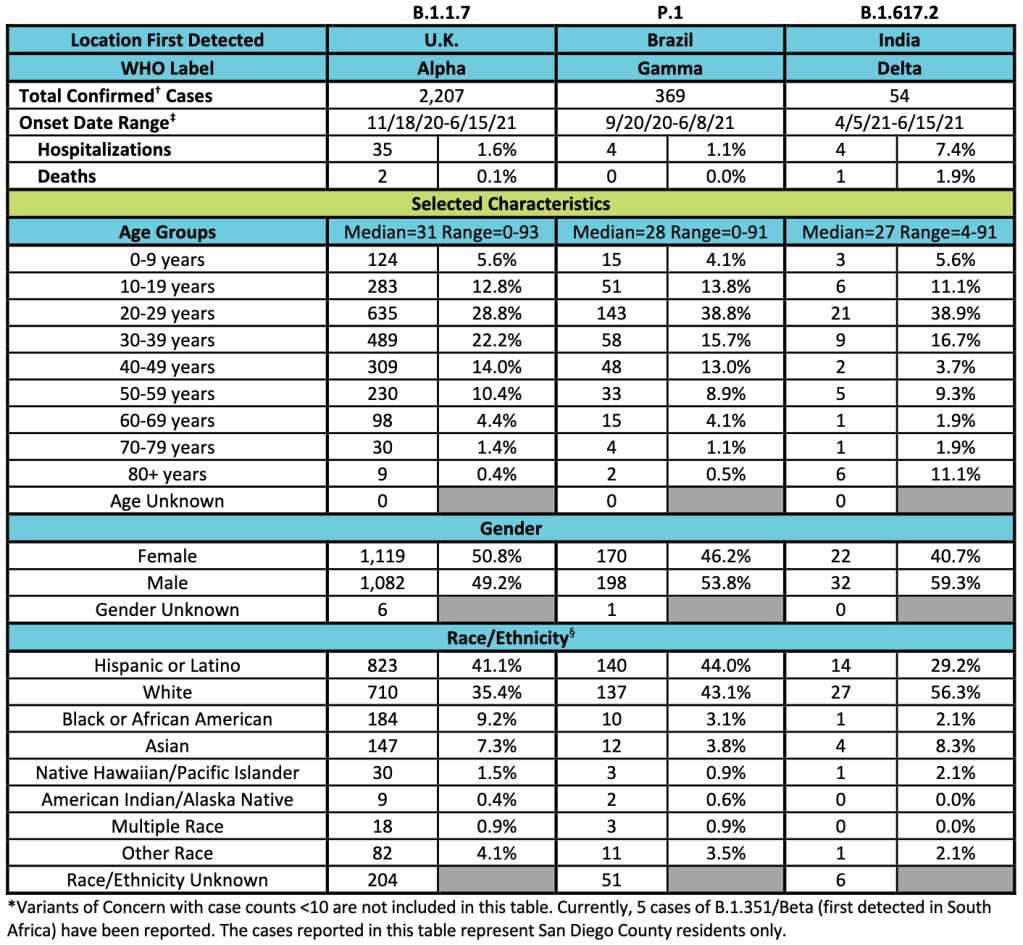
Graph is by me, from data collected from Johns Hopkins University COVID site. Graph is presented in a logarithmic format to emphasize small numbers. Note that each number on the left is 10x higher than the one below it.Graph is by me, from data collected from Johns Hopkins University COVID site. Graph is presented in a logarithmic format to emphasize small numbers. Note that each number on the left is 10x higher than the one below it.Endcoronavirus County Level Map, July 7th, 2021Graph is by me, from data collected from Johns Hopkins University COVID site. Graph is presented in a logarithmic format to emphasize small numbers. Note that each number on the left is 10x higher than the one below it.Graph is by me, from data collected from Johns Hopkins University COVID site. Graph is presented in a logarithmic format to emphasize small numbers. Note that each number on the left is 10x higher than the one below it.Graph is by me, from data collected from San Diego County Public Health. See also regularly updated slides from SD County. Graph is presented in a logarithmic format to emphasize small numbers. Note that each number on the left is 10x higher than the one below it. Numbers are now reported only weekly. While total numbers are accurate, daily numbers are extrapolated from weekly reported numbers.San Diego County COVID-19 Variant Case Summary, July 8, 2021.
I predicted last week that we wouldn’t see a major new spike in cases, and that’s arguably still true, but we are seeing increases in numbers. New cases are currently almost double what they were at this time last week for the US, California, and San Diego County. We’ll have to see how this progresses. I continue to believe at this point that we won’t see a major new peak, but what “major” means is still subjective.
In San Diego County, 79% of eligible residents have received at least 1 dose of vaccine and 68% are fully vaccinated. This represents 105 and 90% respectively of the Counties goal of 75% of the population.
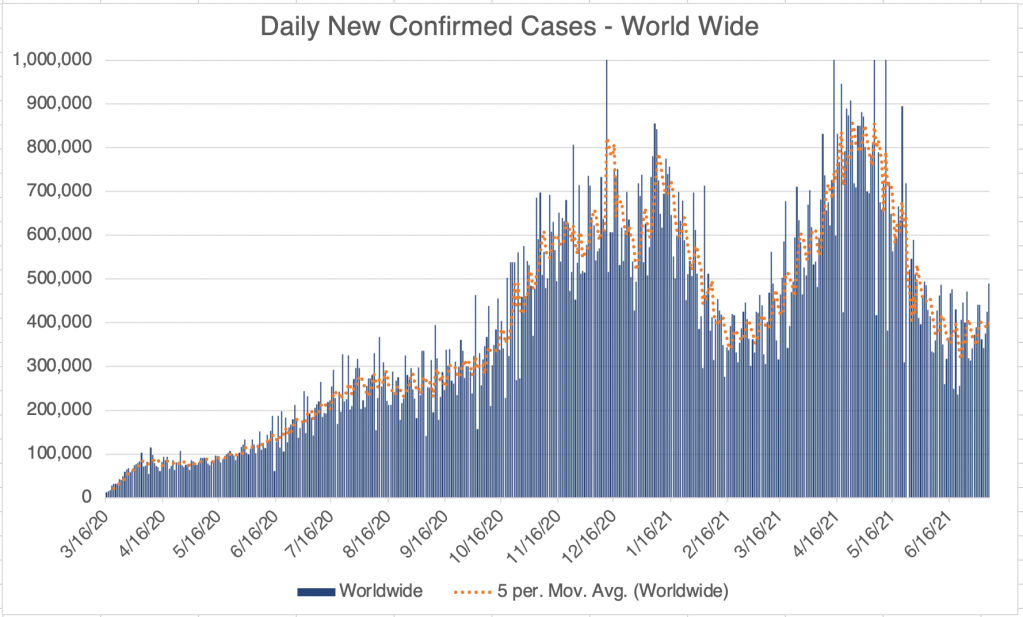
Worldwide, new cases are a little higher than a few weeks ago. Countries with current outbreaks are scattered across the globe, with examples being Russia, South Africa, Indonesia, Tunisia, Cuba, and Columbia.
Graph is by me, from data collected from Johns Hopkins University COVID site. Graph is presented in a logarithmic format to emphasize small numbers. Note that each number on the left is 10x higher than the one below it.