Case Update, August 25th, 2021

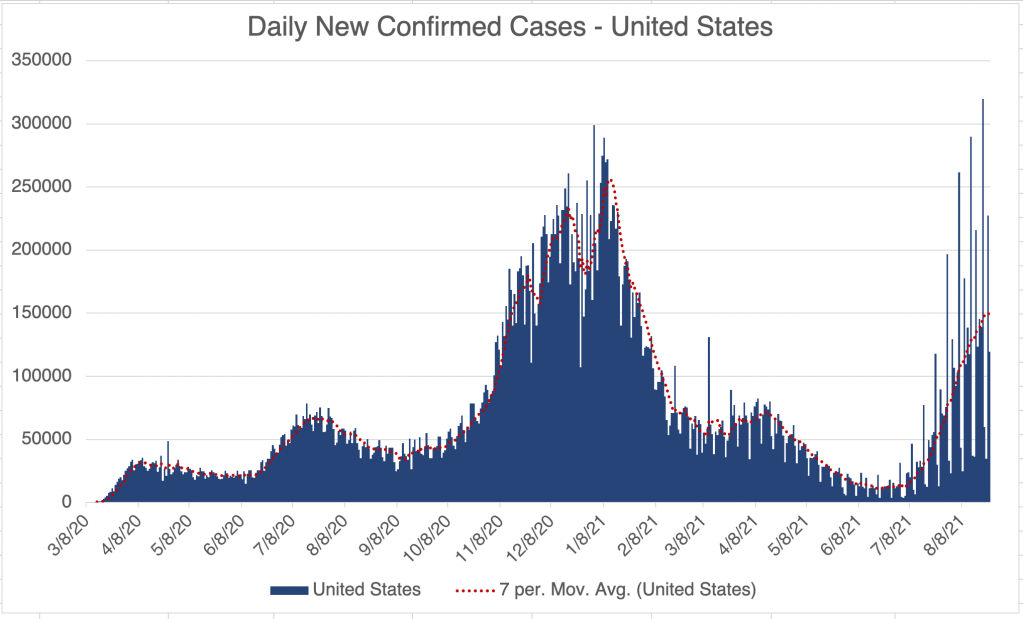
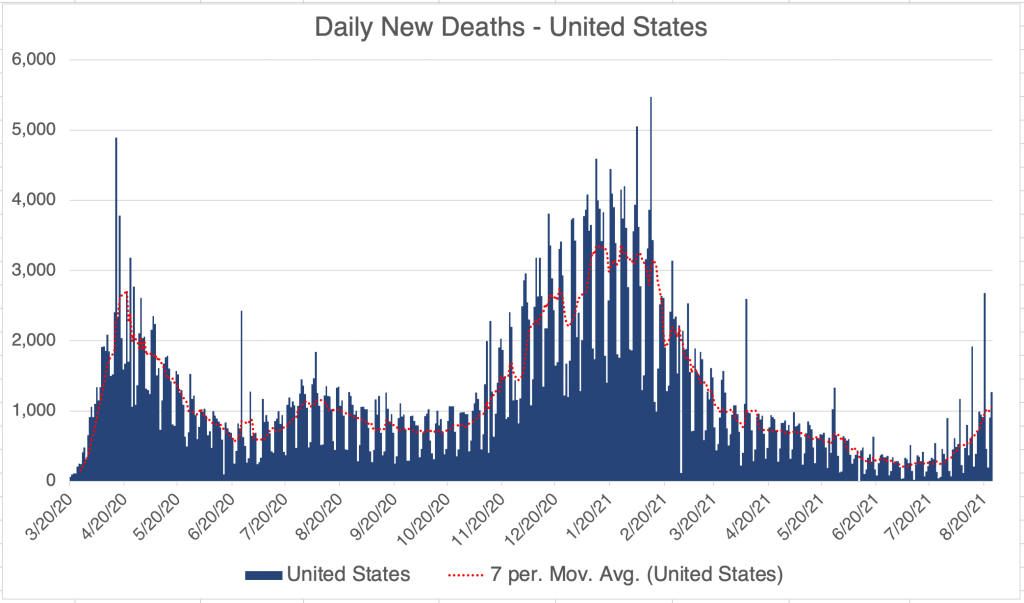
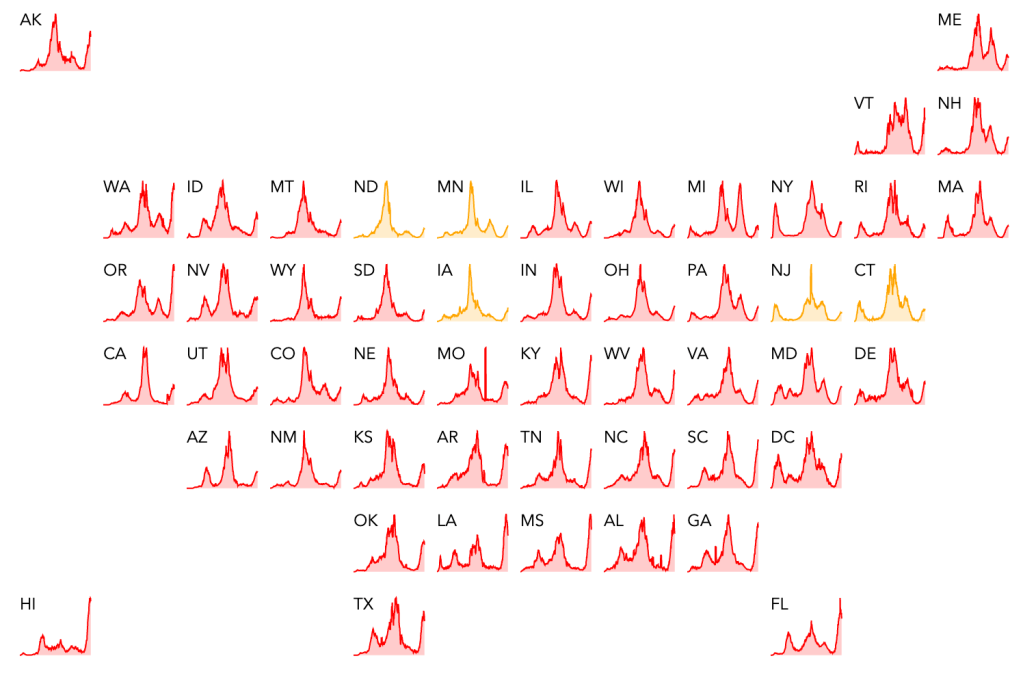
This is a brief case update. The US is still increasing in new cases, but the number of new cases is slowing. Several states appear to be past the peak new cases are now headed down, including Louisiana, Texas and Vermont. New COVID deaths in the US are on the rise, but are still far lower then during last wave. It will take several weeks to know how many new deaths we’ll see, since new deaths trail new cases by between 1 and 4 weeks.

Graph is by me, from data collected from Johns Hopkins University COVID site. Graph is presented in a linear format.
Endcoronavirus County Level Map, August 25th, 2021


Endcoronavirus State Level Map, August 25th, 2021

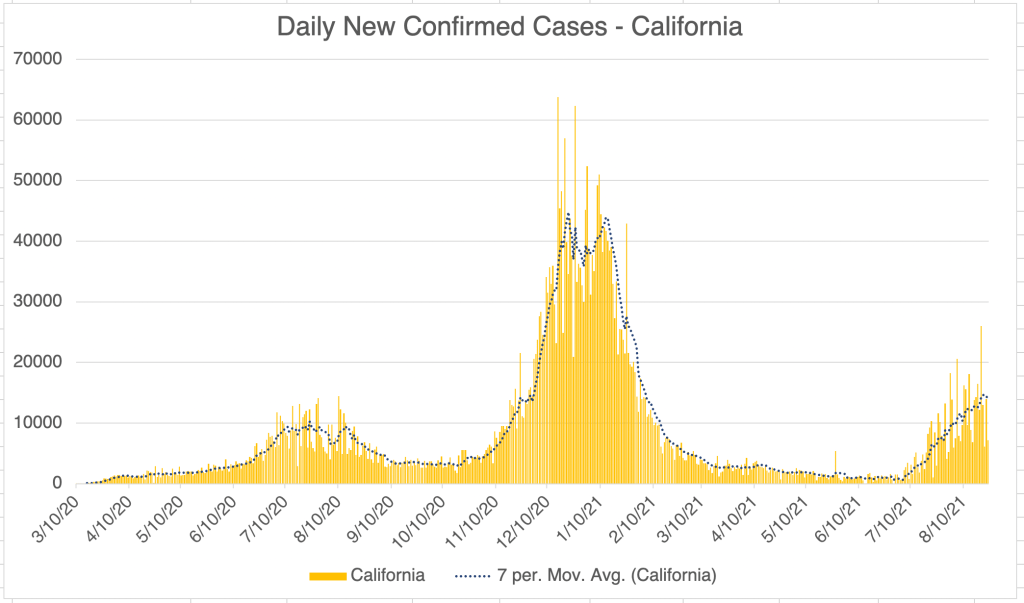
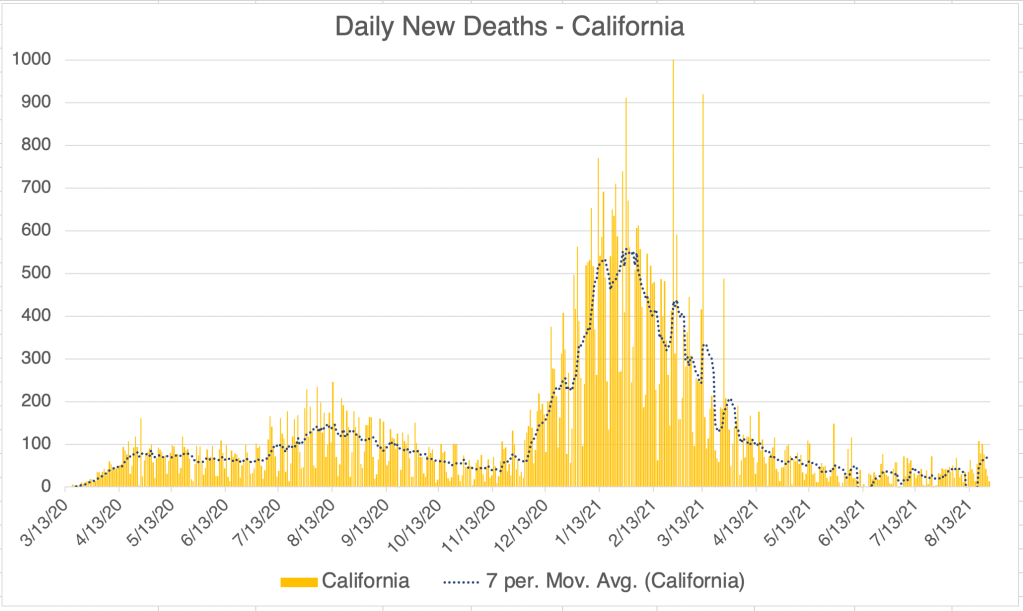
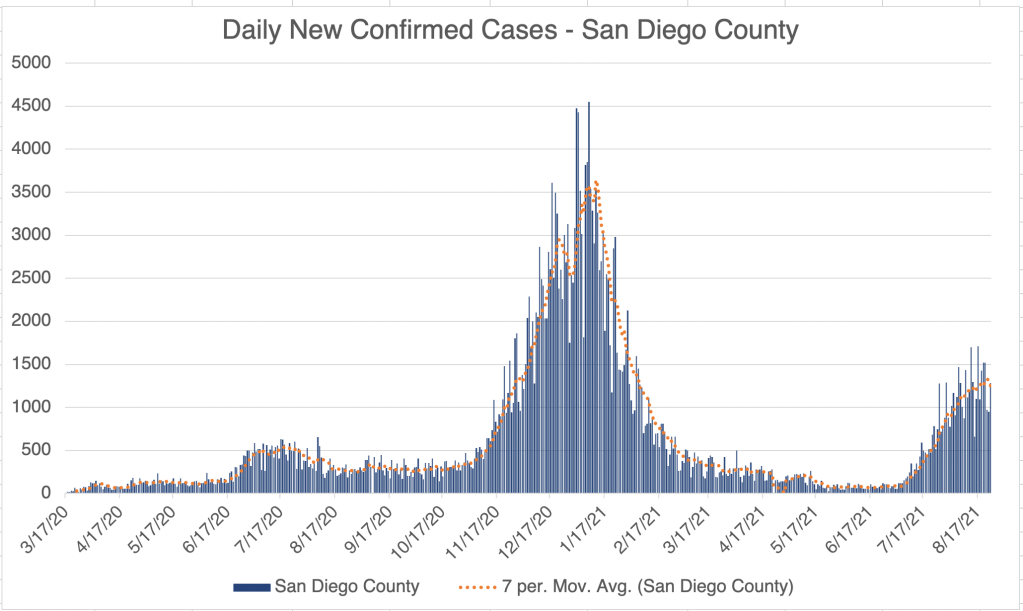
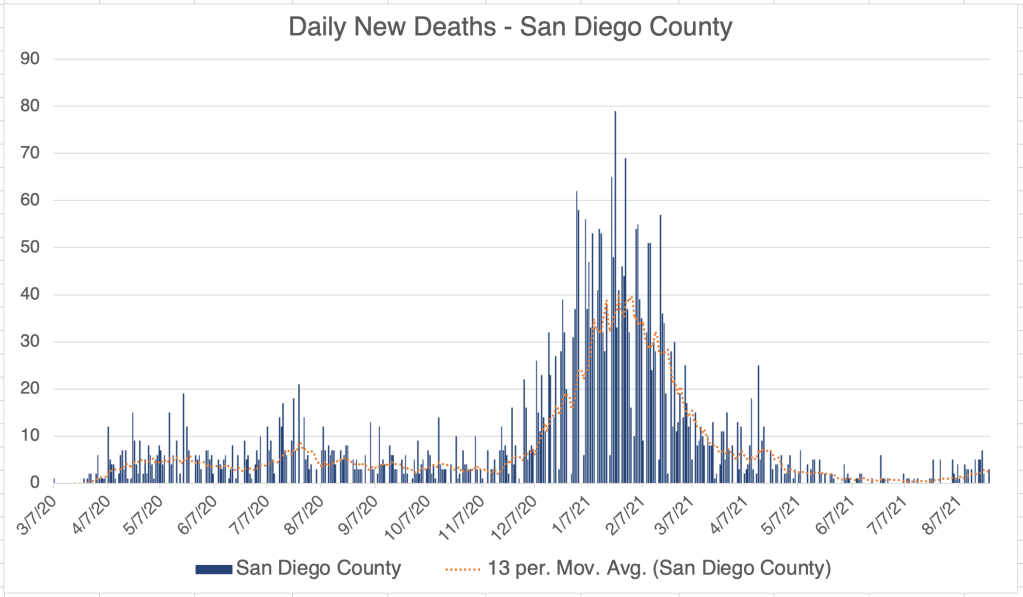
New cases in California and San Diego continue to go down for the second week. New deaths are starting to creep up for both regions, but remain relatively low.

Graph is by me, from data collected from Johns Hopkins University COVID site. Graph is presented in a linear format.
Graph is by me, from data collected from San Diego County Public Health. See also regularly updated slides from SD County.
Graph is by me, from data collected from Johns Hopkins University COVID site. Graph is presented in a linear format.

Don’t fear, but be smart,
Erik

Leave a Reply

Fill in your details below or click an icon to log in:

WordPress.com Logo

You are commenting using your WordPress.com account. Log Out /  Change )

Twitter picture

You are commenting using your Twitter account. Log Out /  Change )

Facebook photo

You are commenting using your Facebook account. Log Out /  Change )

Connecting to %s