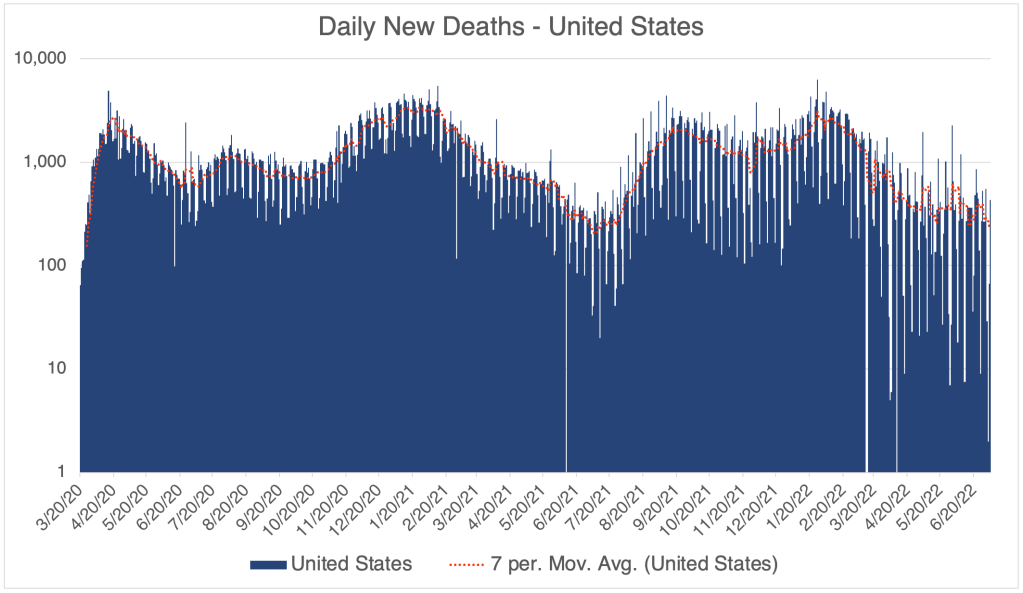
This is a COVID Update. I’ll also ponder again if we have entered the endemic phase of COVID.
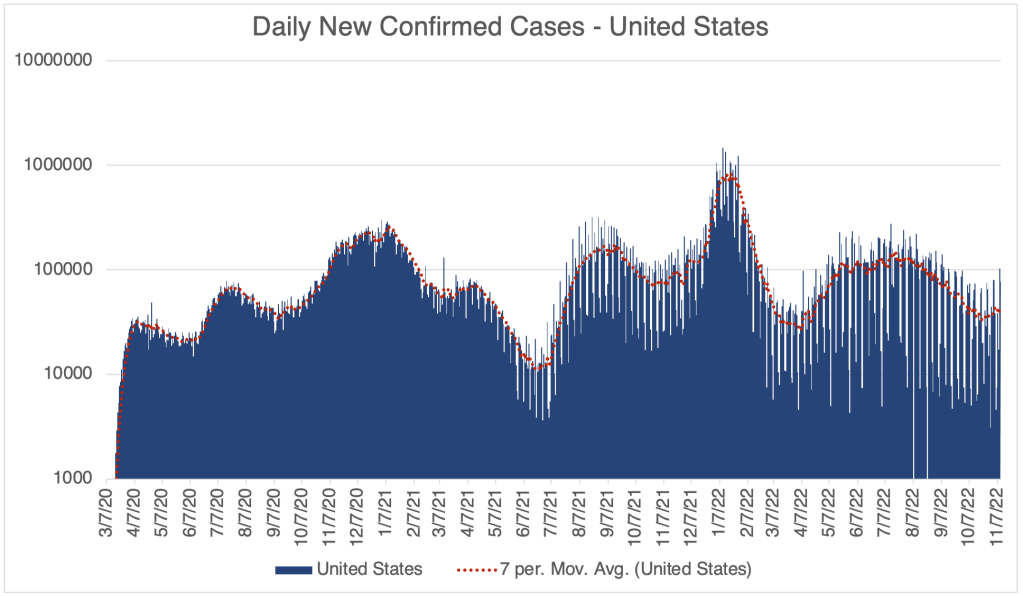
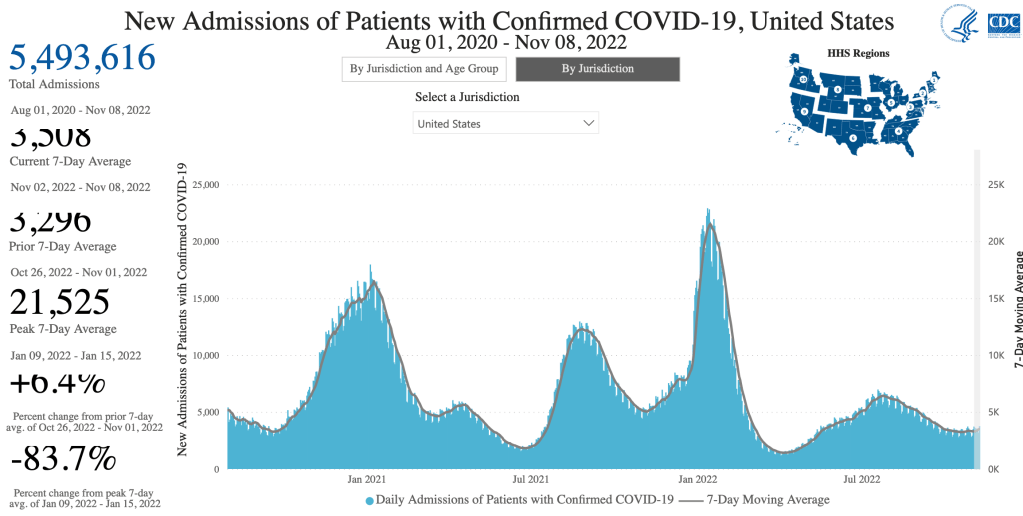
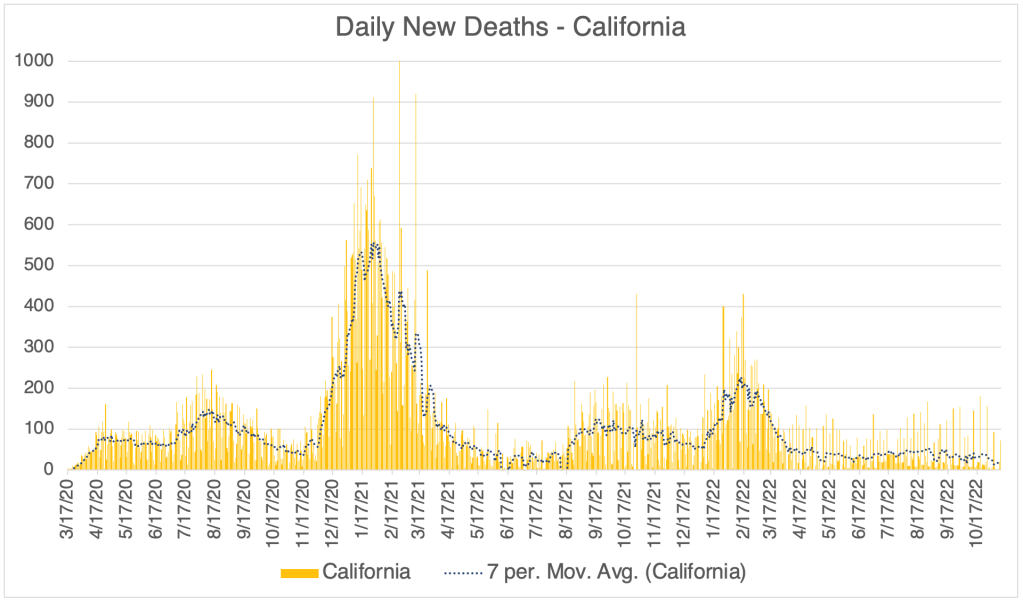
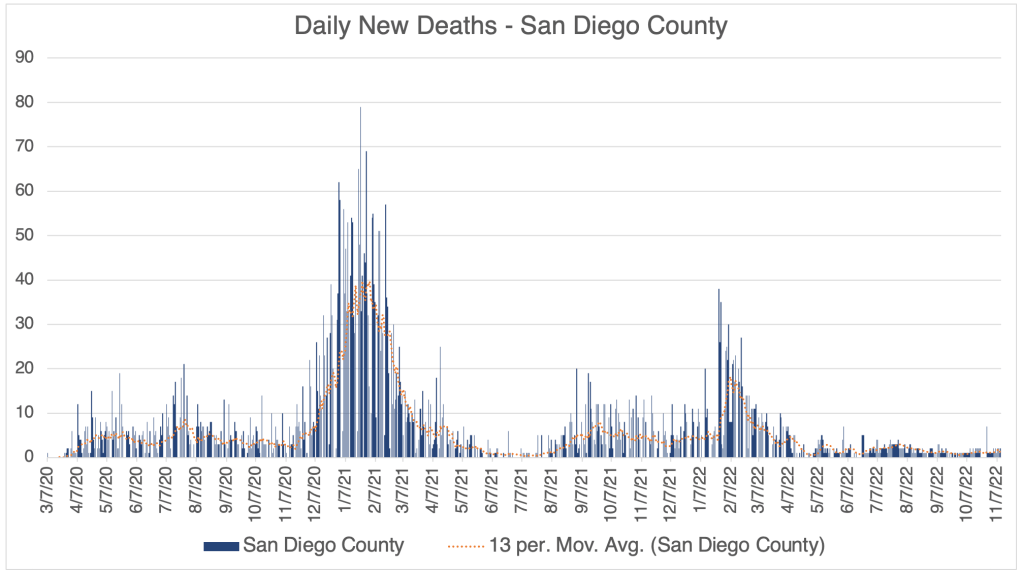
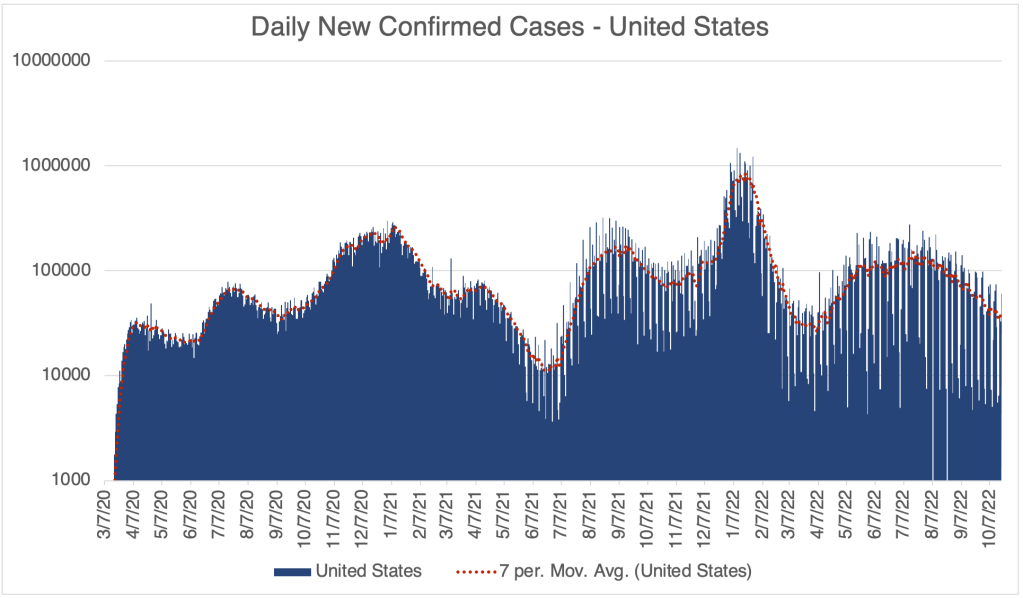
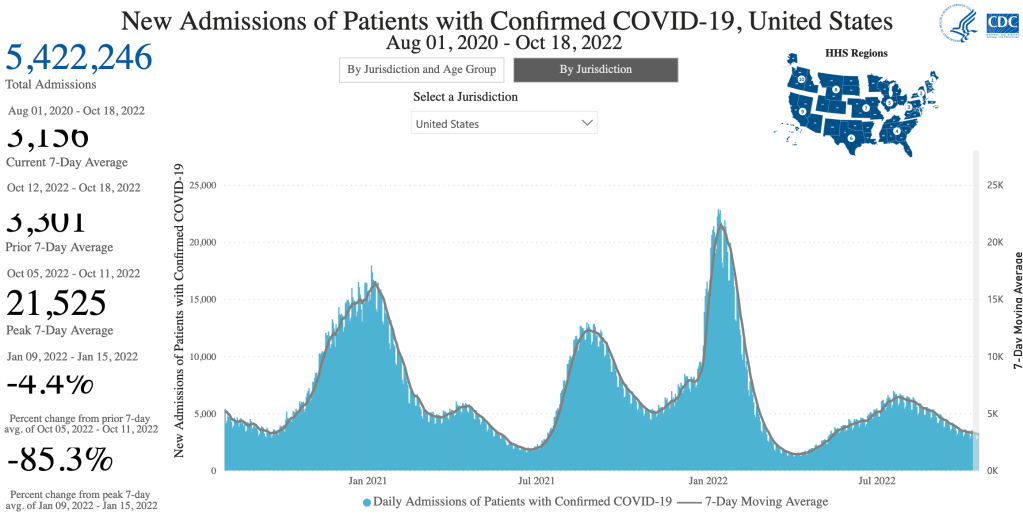
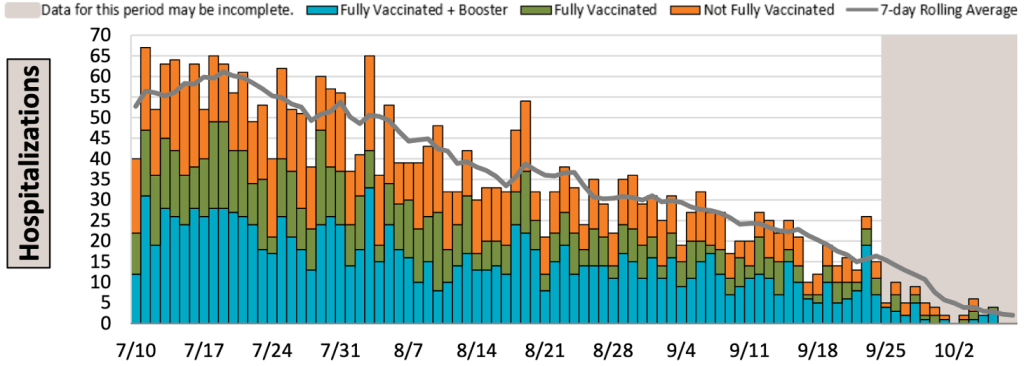
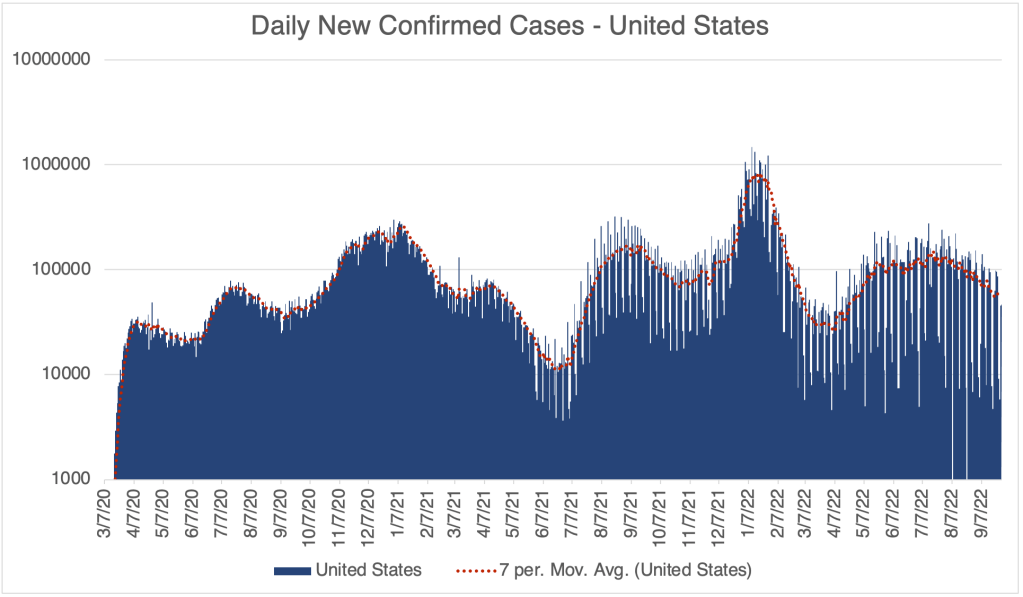
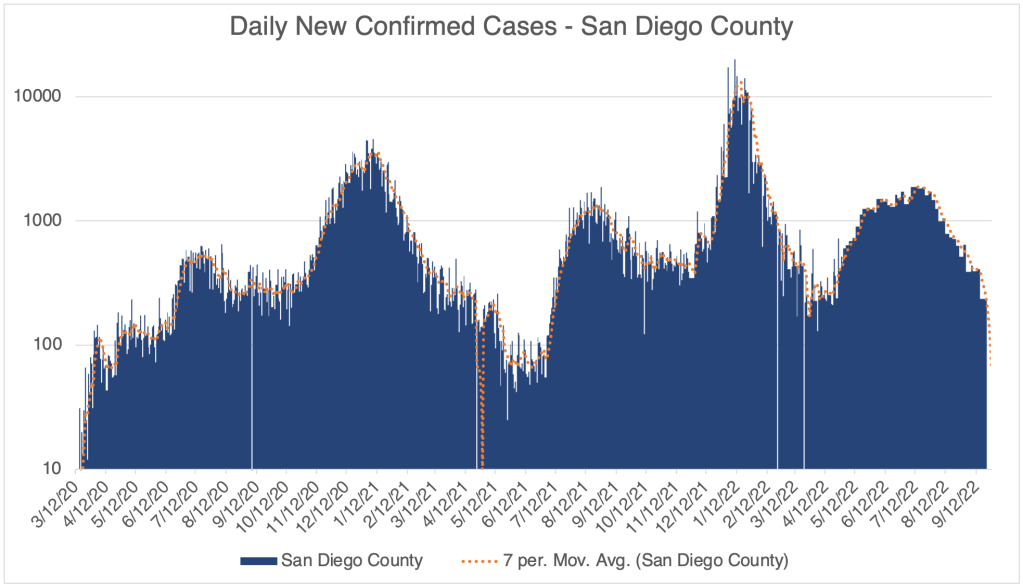
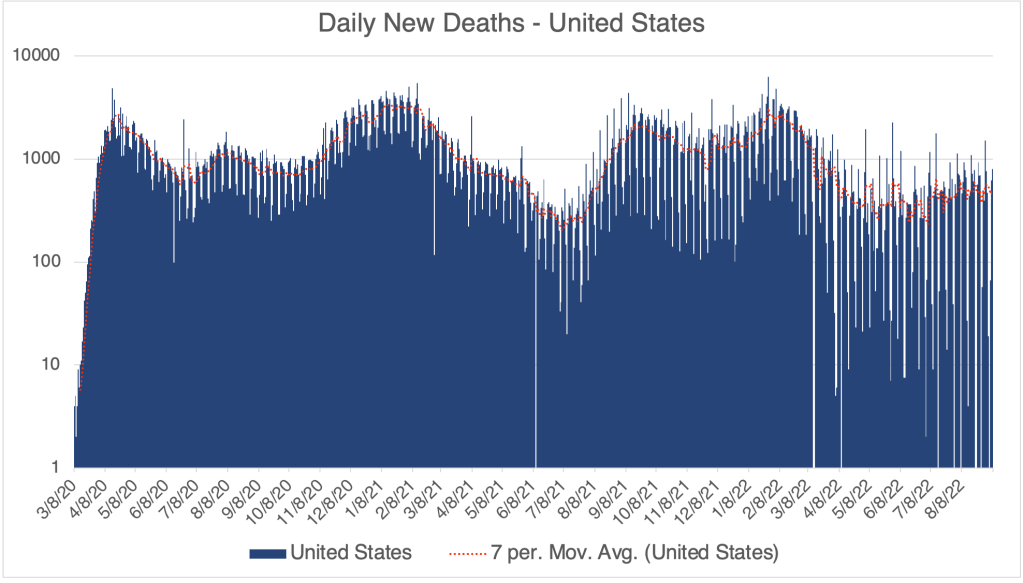
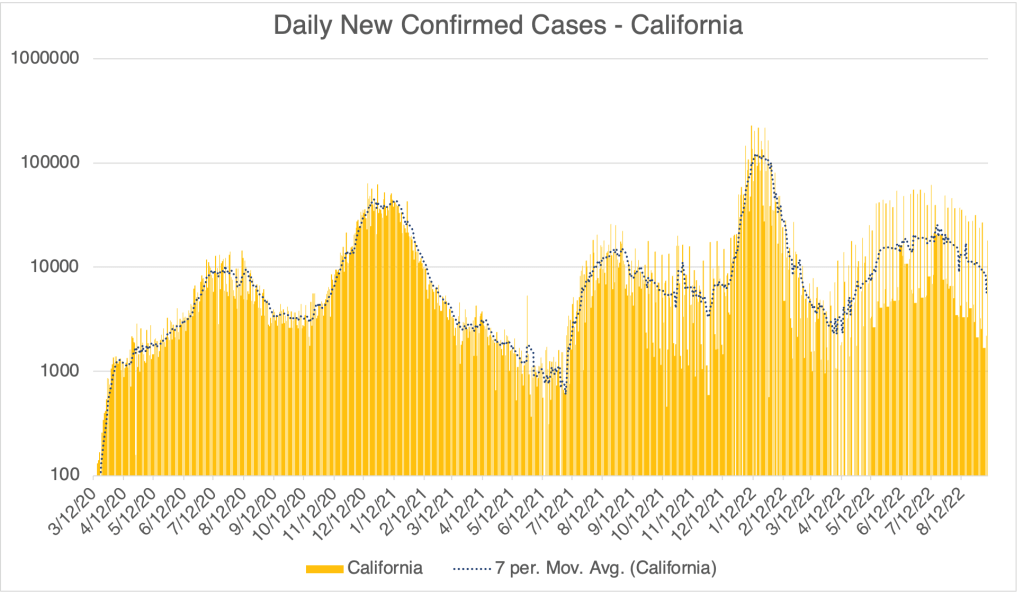
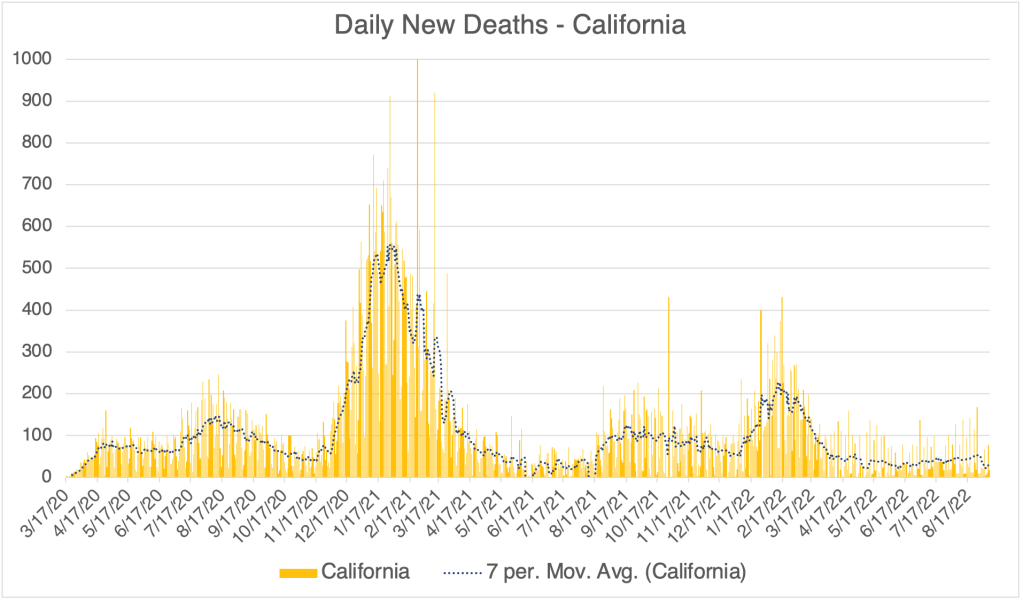
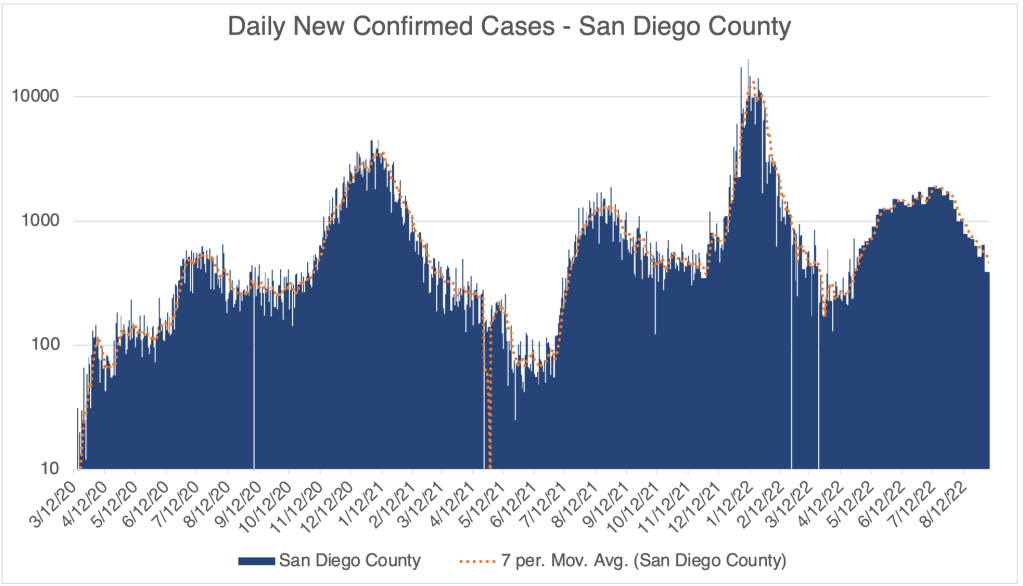
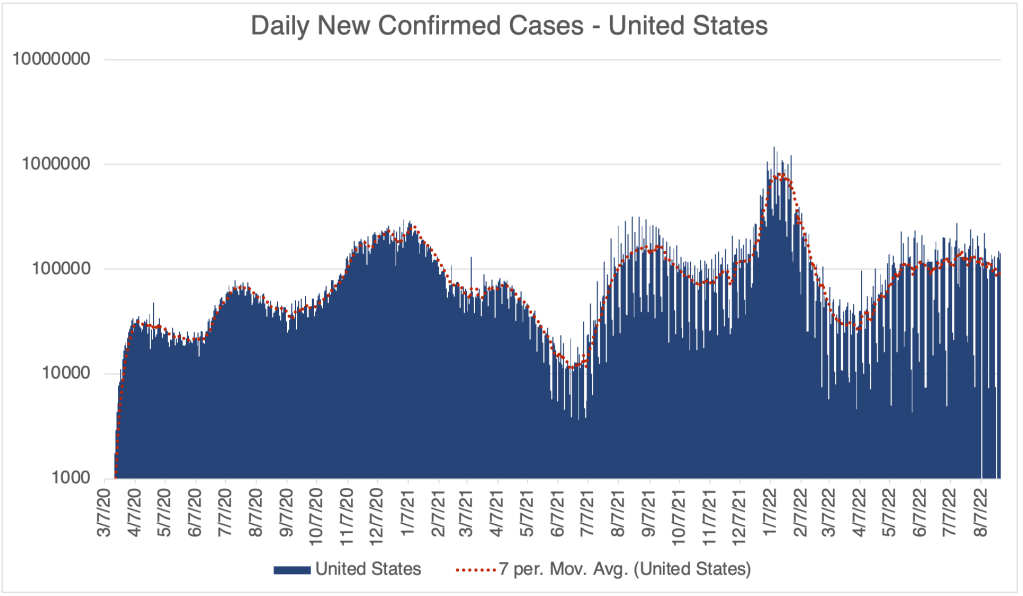
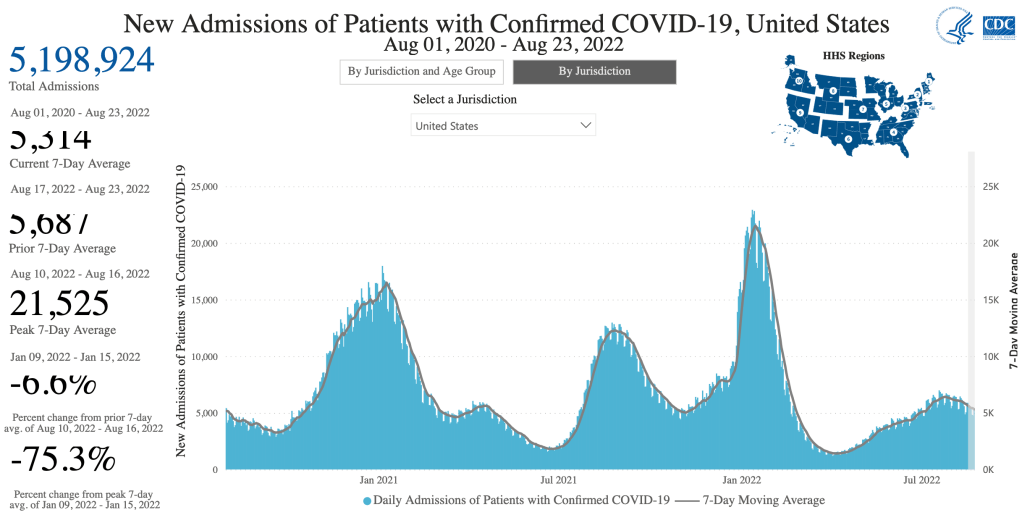
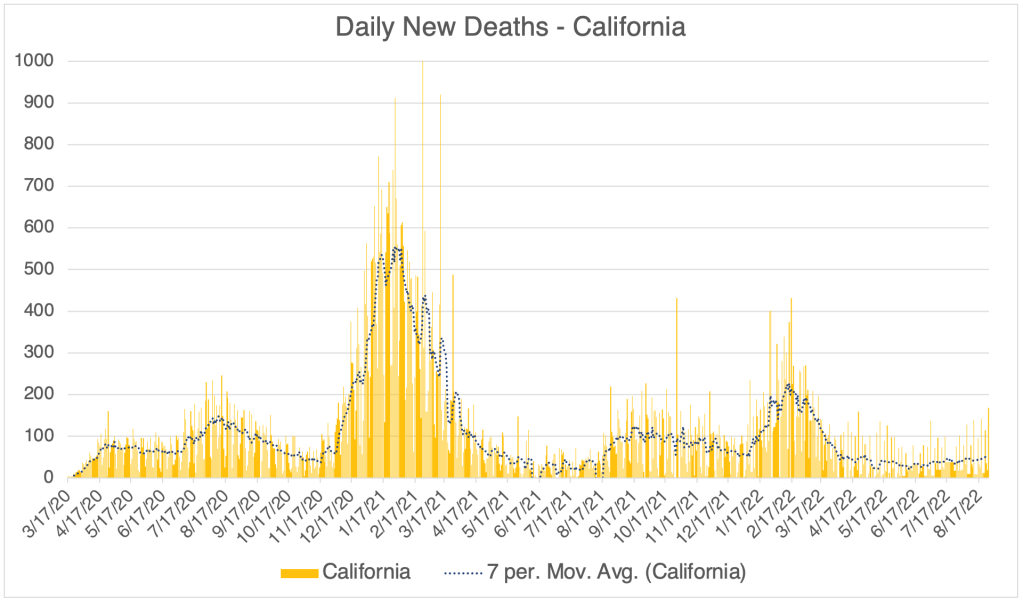
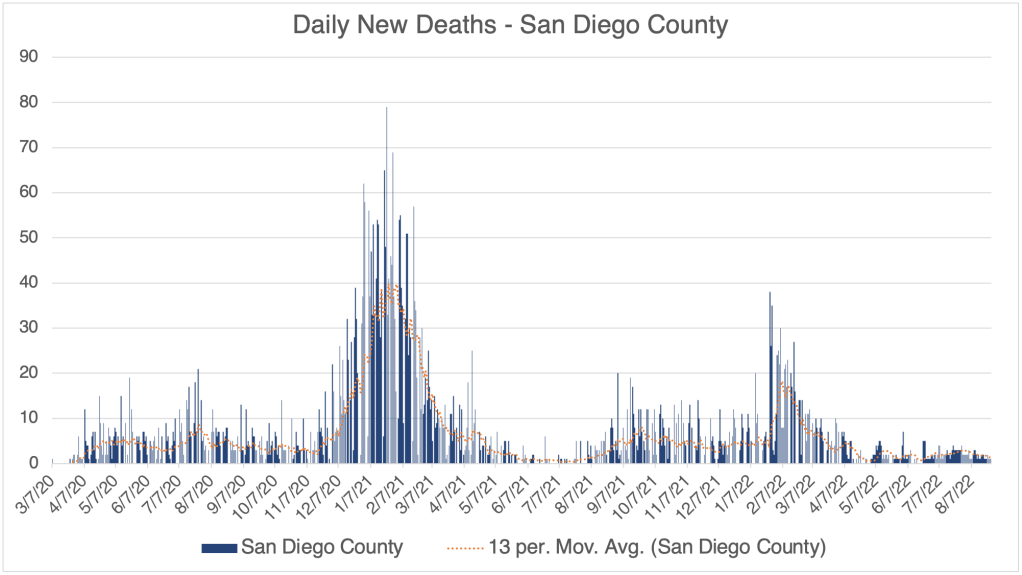
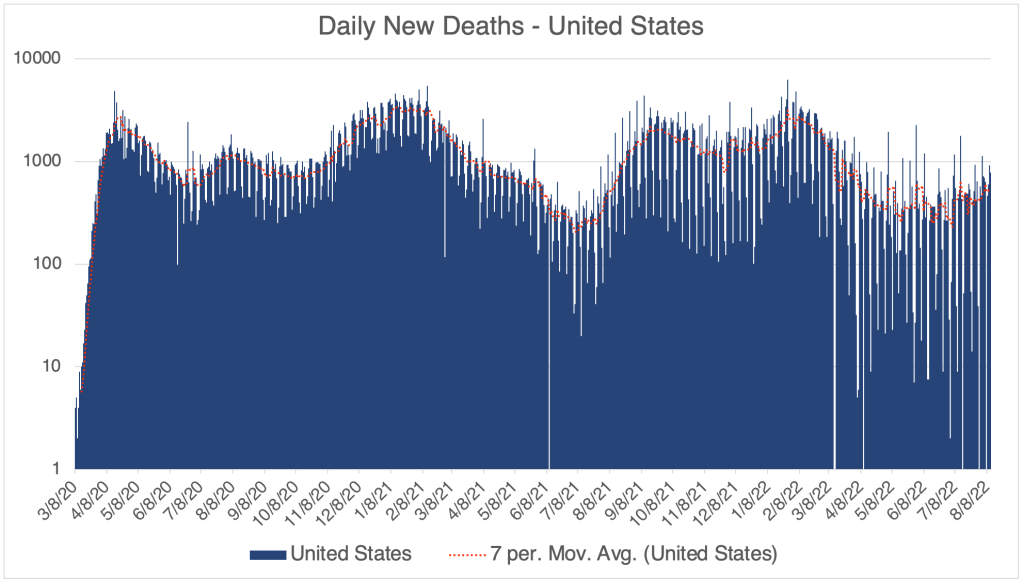
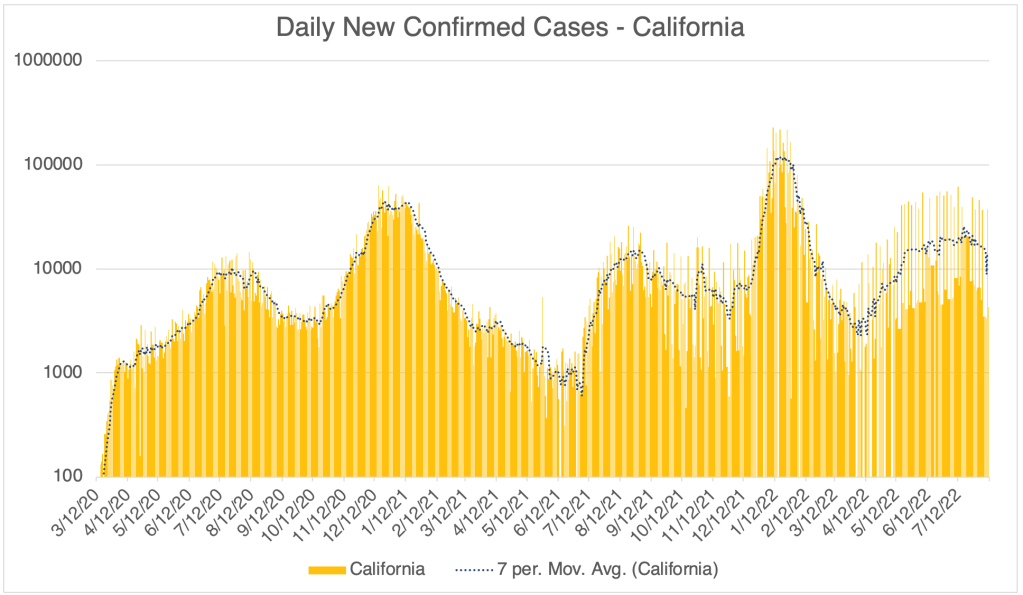
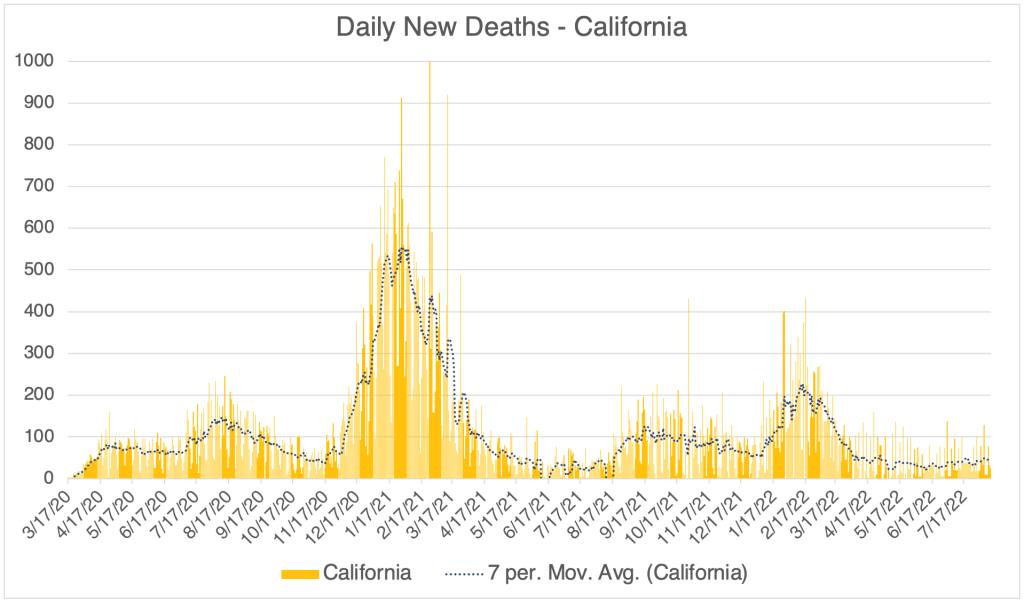
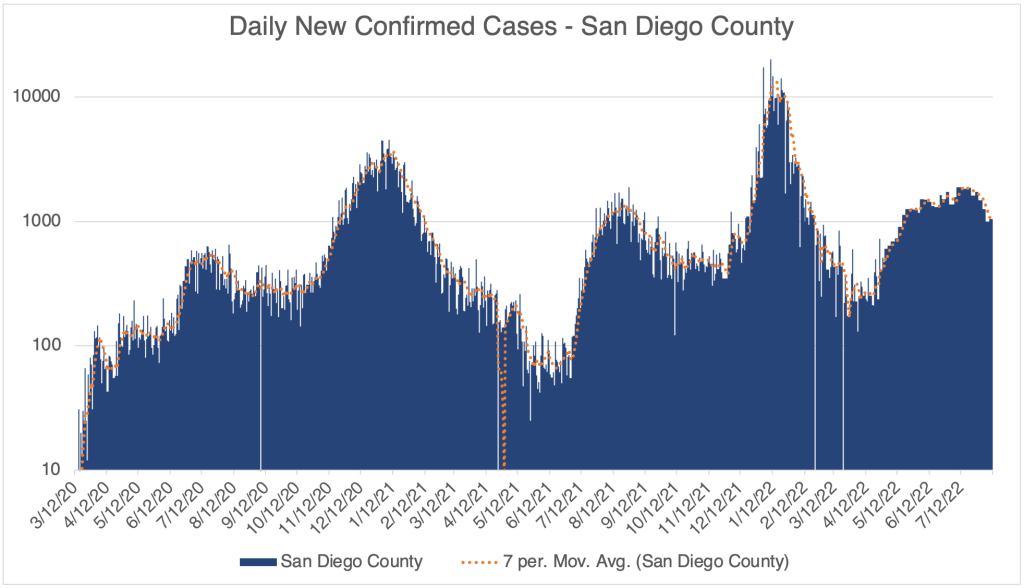
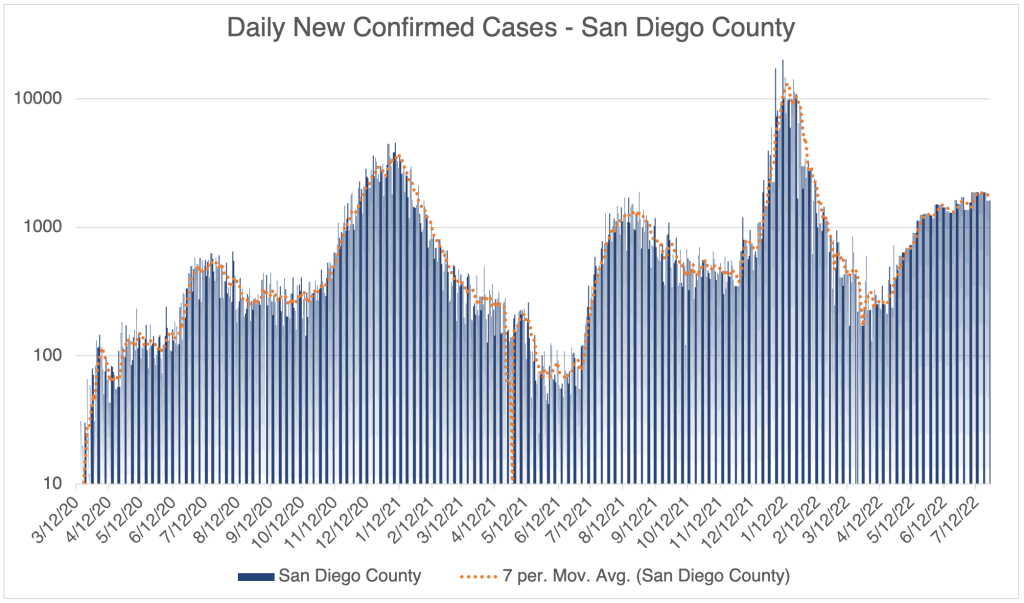
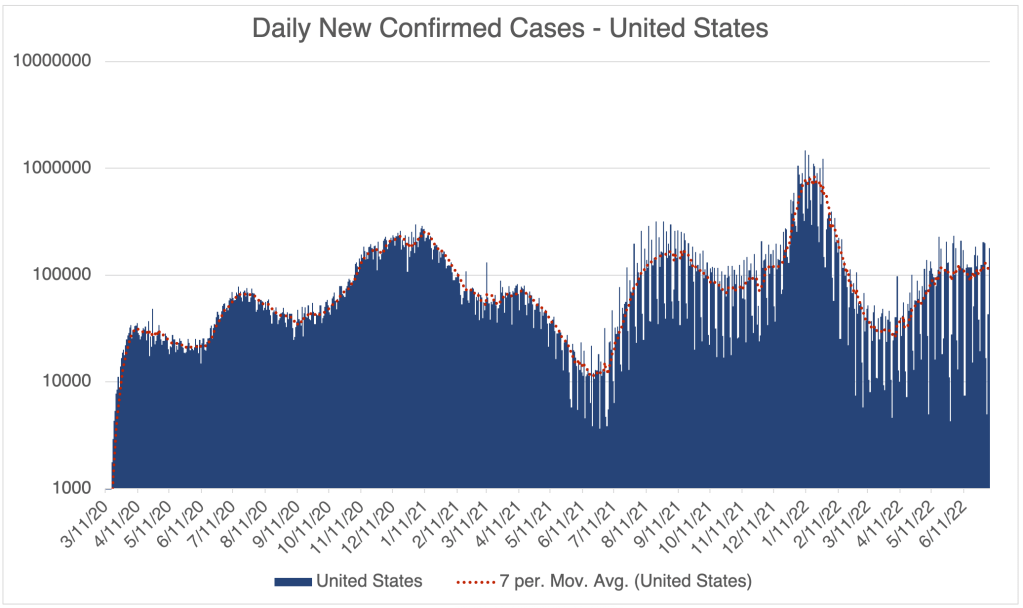
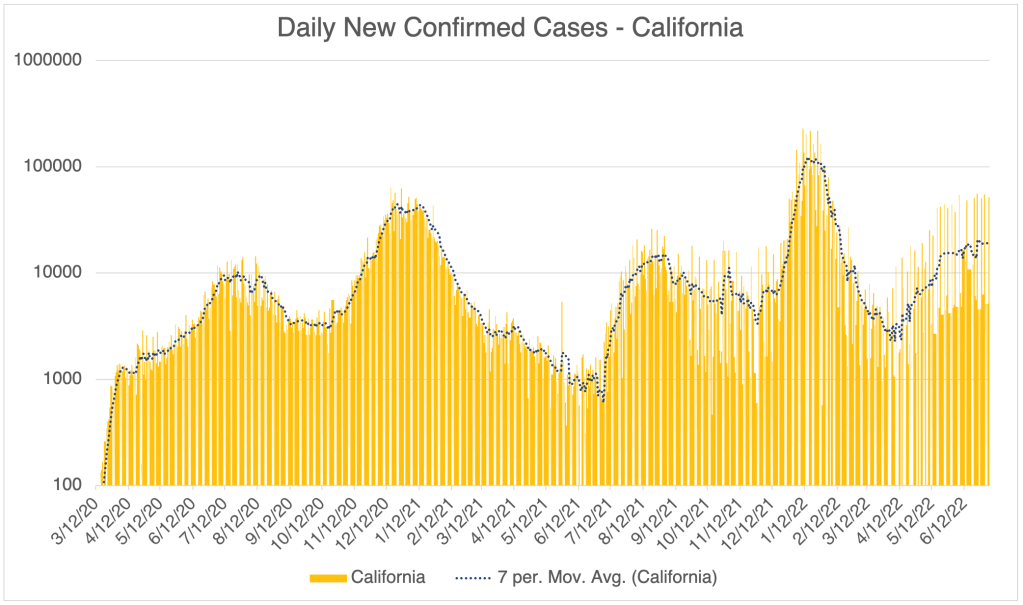
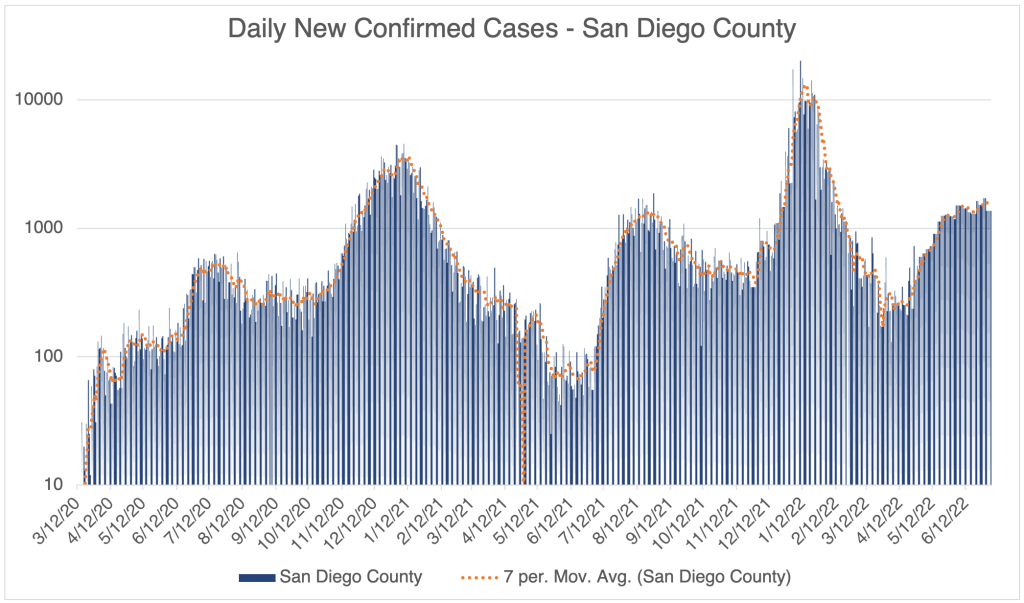
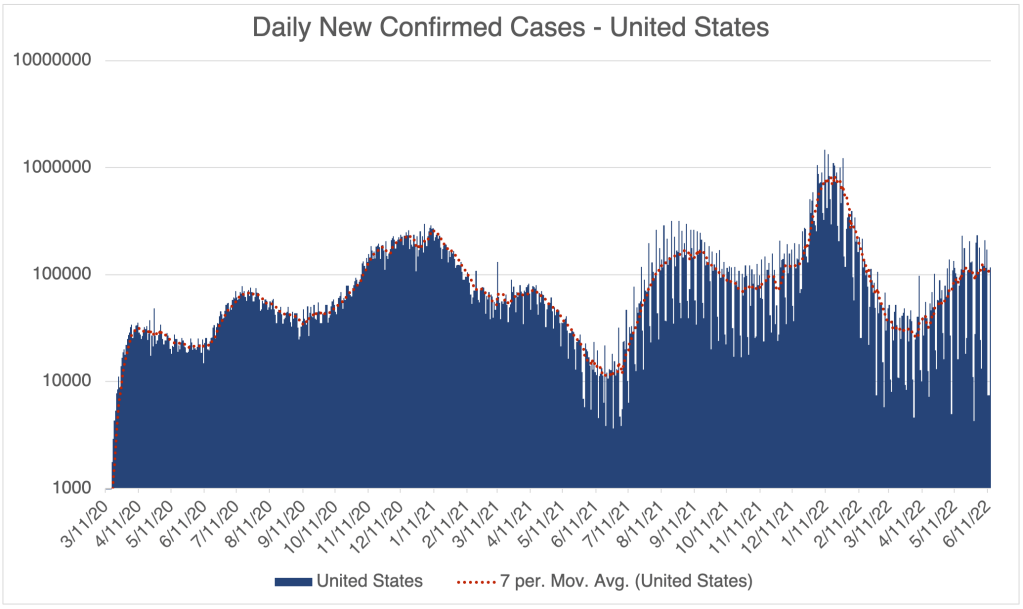
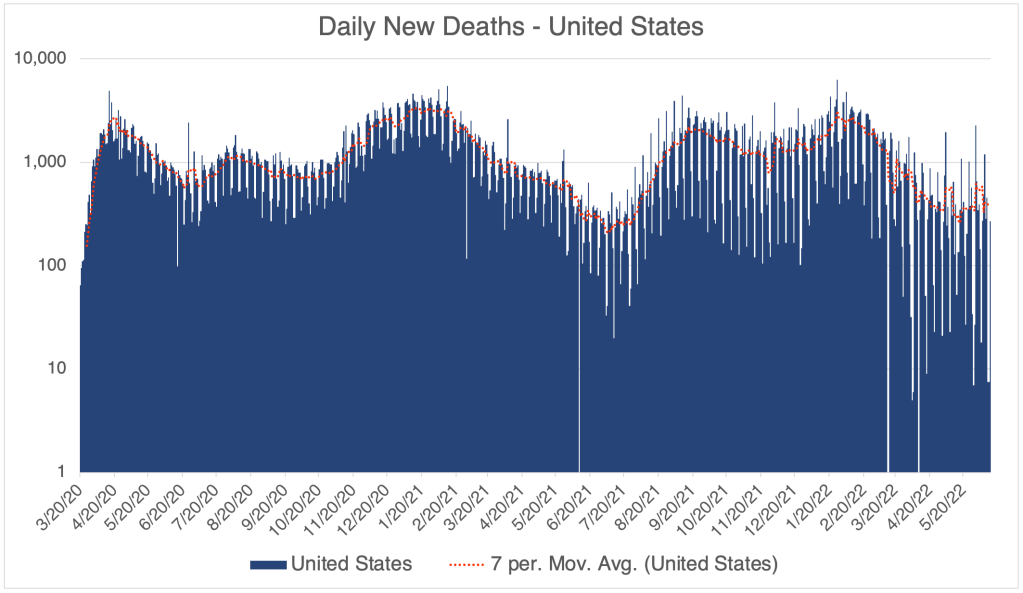
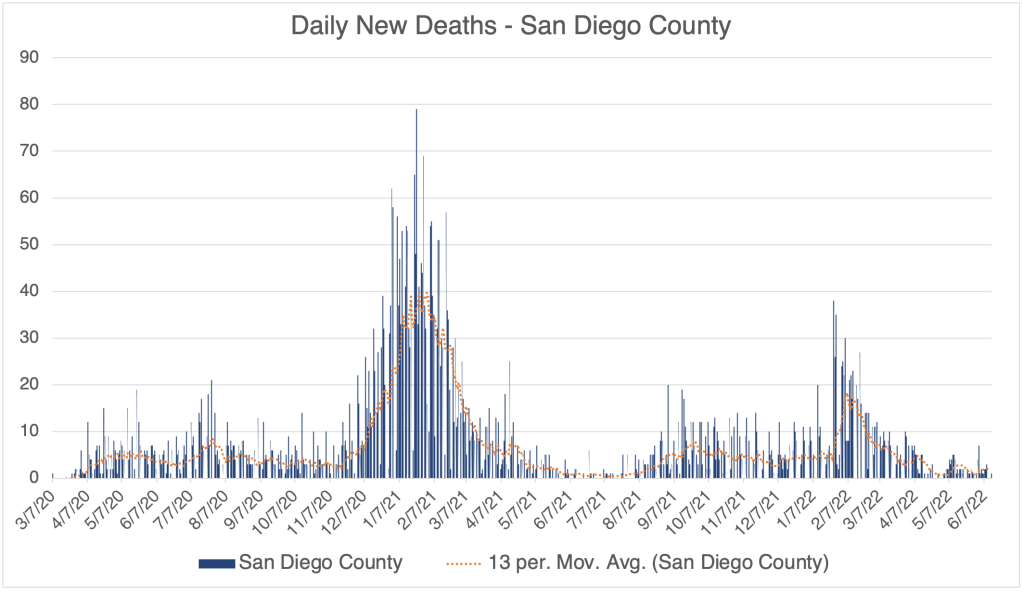
In the US, and San Diego County, case numbers are beginning to climb slightly, perhaps suggesting the start of a fall wave of new cases. California isn’t showing this trend yet. Hospitalizations are not rising for the time being, so all this means more people are entering the medical system with COVID, but this isn’t yet translating into more hospitalizations. So current cases are more mild and moderate than severe. This trend is new, so we may see this change later.
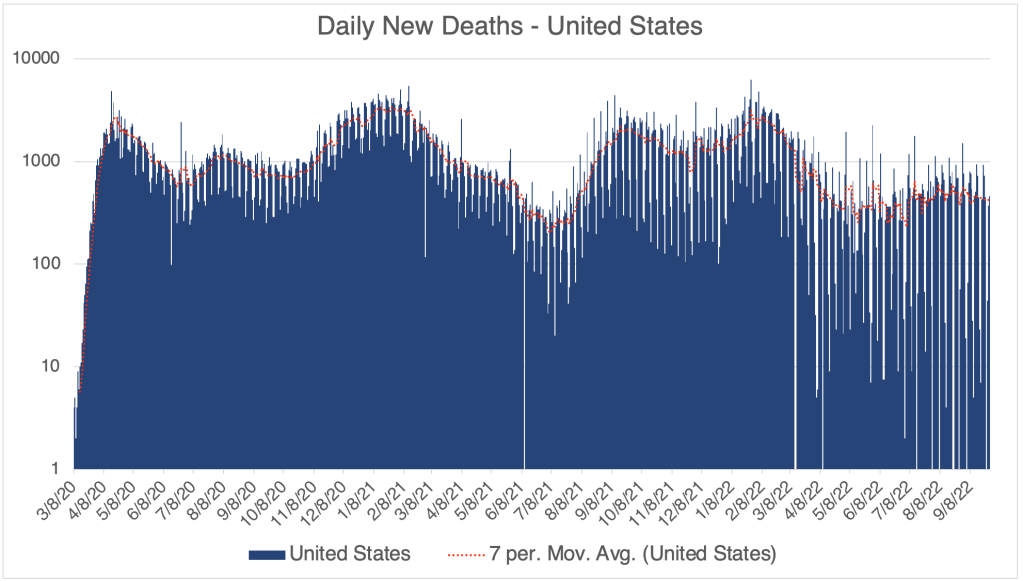
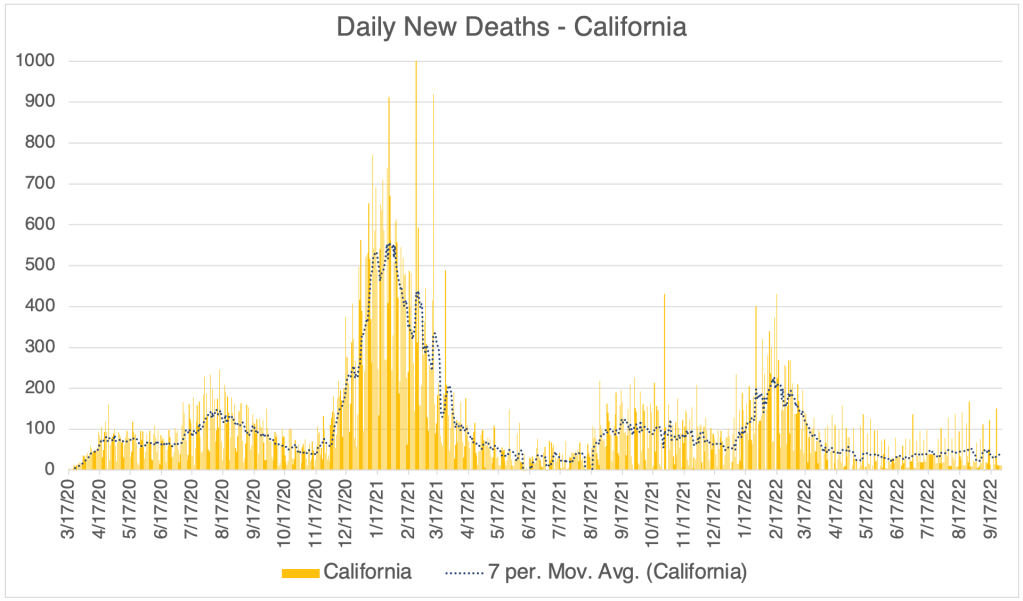
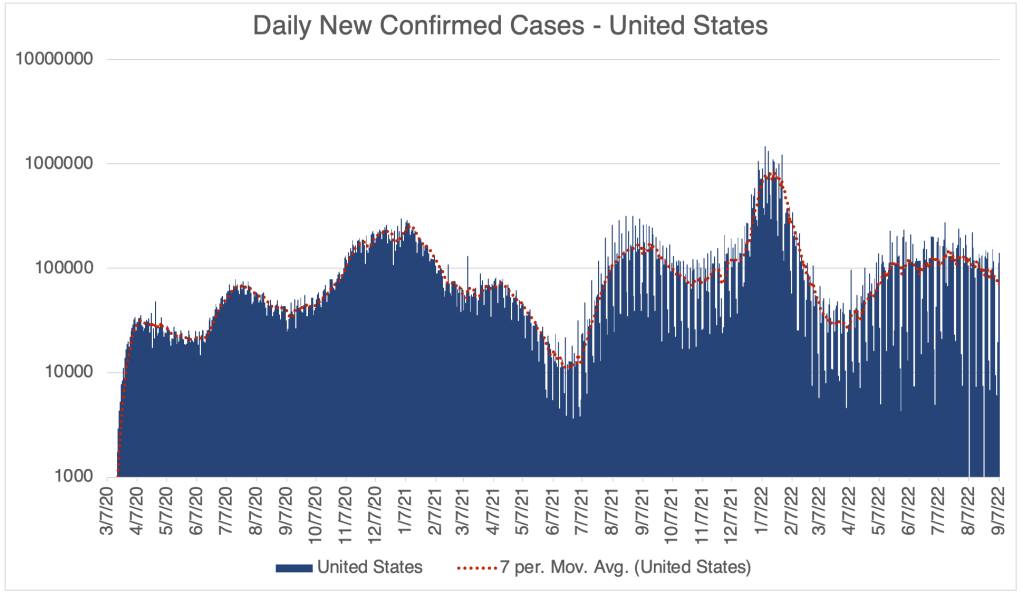
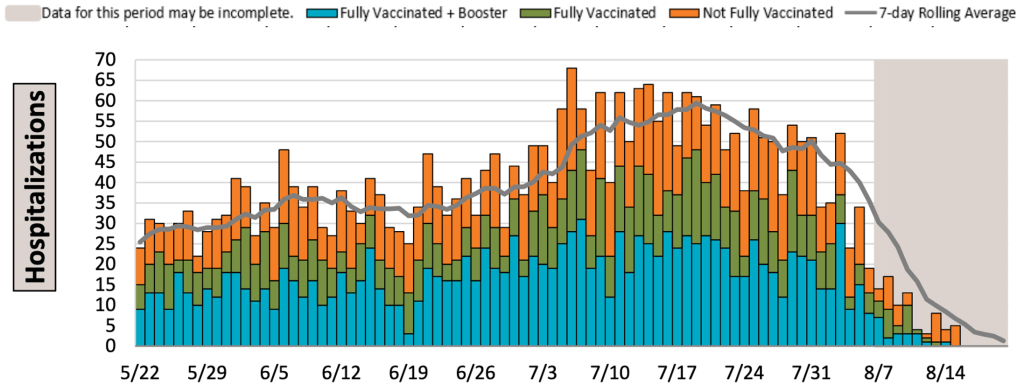
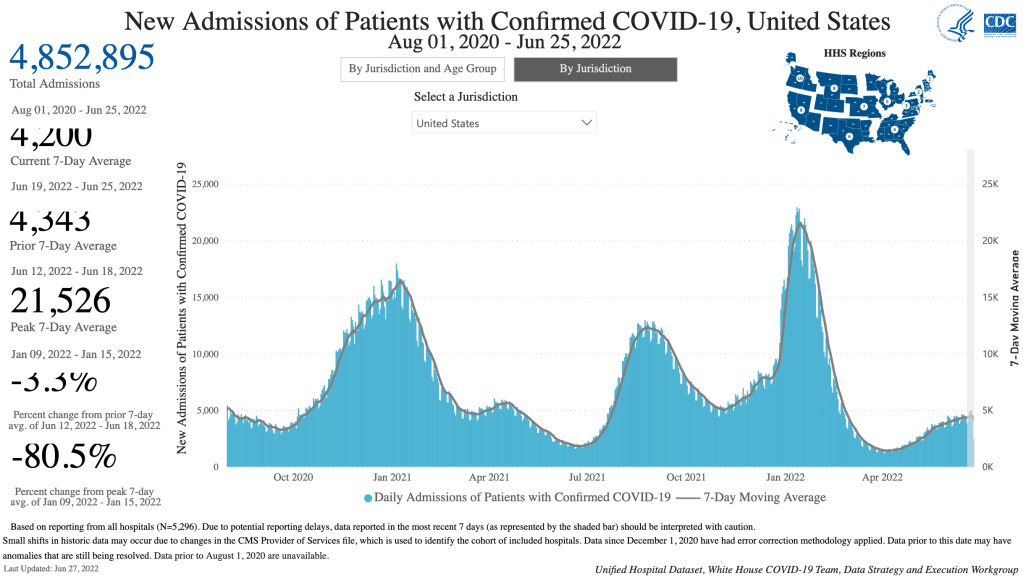
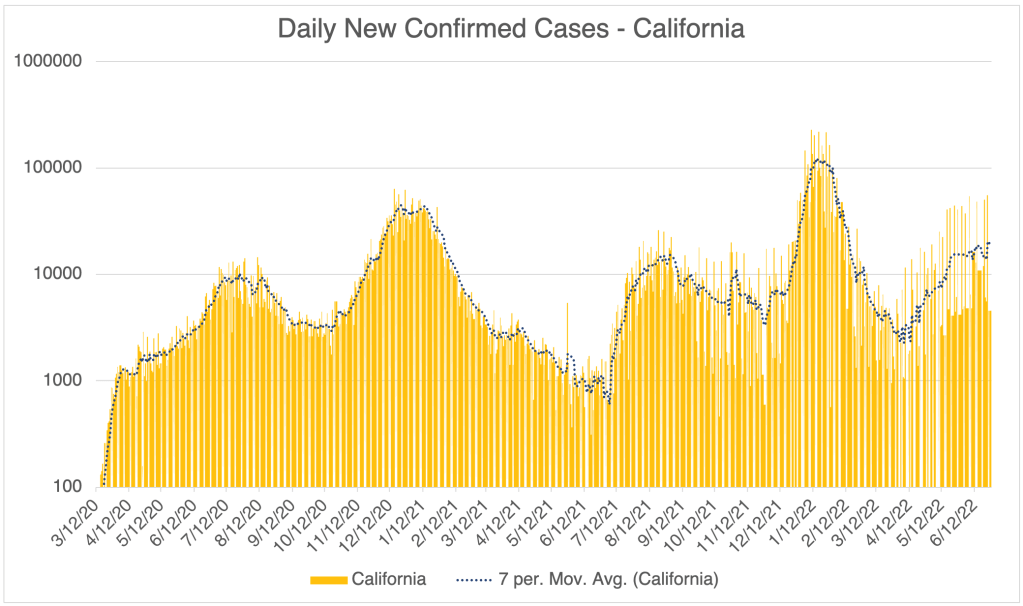
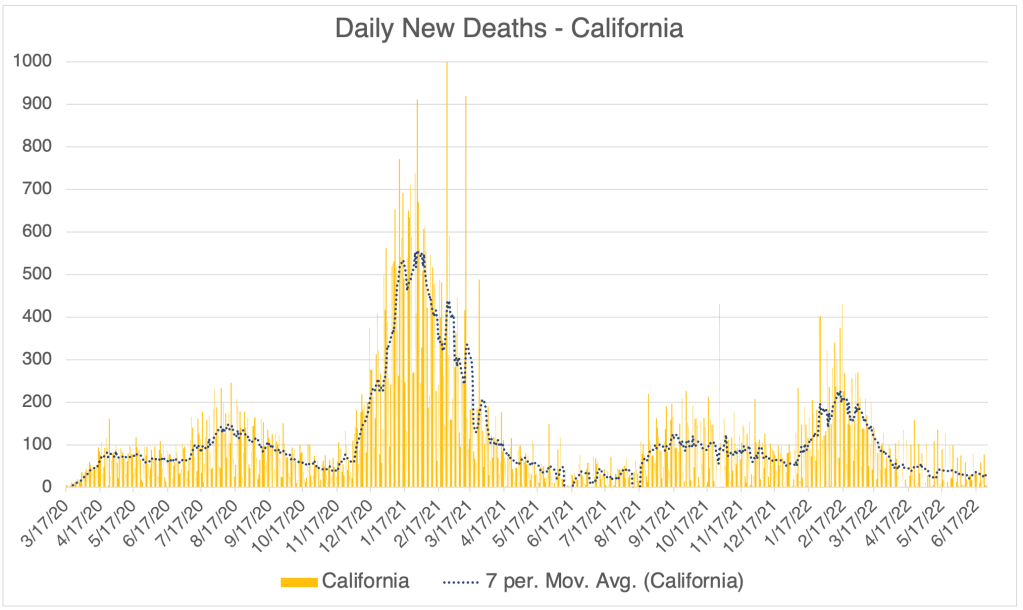
Graph is by me, from data collected from Johns Hopkins University COVID site. Graph is presented in a logarithmic format to emphasize small numbers. Note that each number on the left is 10x higher than the one below it.Graph is by me, from data collected from Johns Hopkins University COVID site. Graph is presented in a logarithmic format to emphasize small numbers. Note that each number on the left is 10x higher than the one below it.Hospitalizations, from the CDC website.Graph is by me, from data collected from Johns Hopkins University COVID site. Graph is presented in a logarithmic format to emphasize small numbers. Note that each number on the left is 10x higher than the one below it.Graph is by me, from data collected from Johns Hopkins University COVID site. Graph is presented in a linear format.Graph is by me, from data collected from San Diego County Public Health. Graph is presented in a logarithmic format to emphasize small numbers. San Diego County now only releases information on Thursday each week. Data points shown are extrapolated using this information.Graph is by me, from data collected from San Diego County Public Health. Graph is presented in a linear format. San Diego County now only releases information on Thursday each week. Data points shown are extrapolated using this information.Hospitalizations in SD County, July 10th to October 10, 2022. Gray area represents time-frame in which data is still being collected. Note that a significant number of hospitalizations are among the vaccinated.Graph is by me, from data collected from Johns Hopkins University COVID site. Graph is presented in a linear format.
Is COVID endemic yet? An epidemic is an outbreak in a larger region like a state, country or even continent. A pandemic is an outbreak that spans multiple continents. An outbreak becomes endemic when it becomes widespread in an area and is beyond control by disease prevention means. For example, flu and HIV are both endemic, a now permanent part of life in the world. Many people I have spoken to have believed that COVID has been endemic for a long time, and perhaps was always destined to be. I was optimistic for a long time, thinking that our immune systems would be able to eventually catch up with it and make it extinct. Unfortunately, I think I lost hope in that this week. Some of you are saying “what took you so long?” I get it. But I think it’s important to have good reasons for why we believe something.
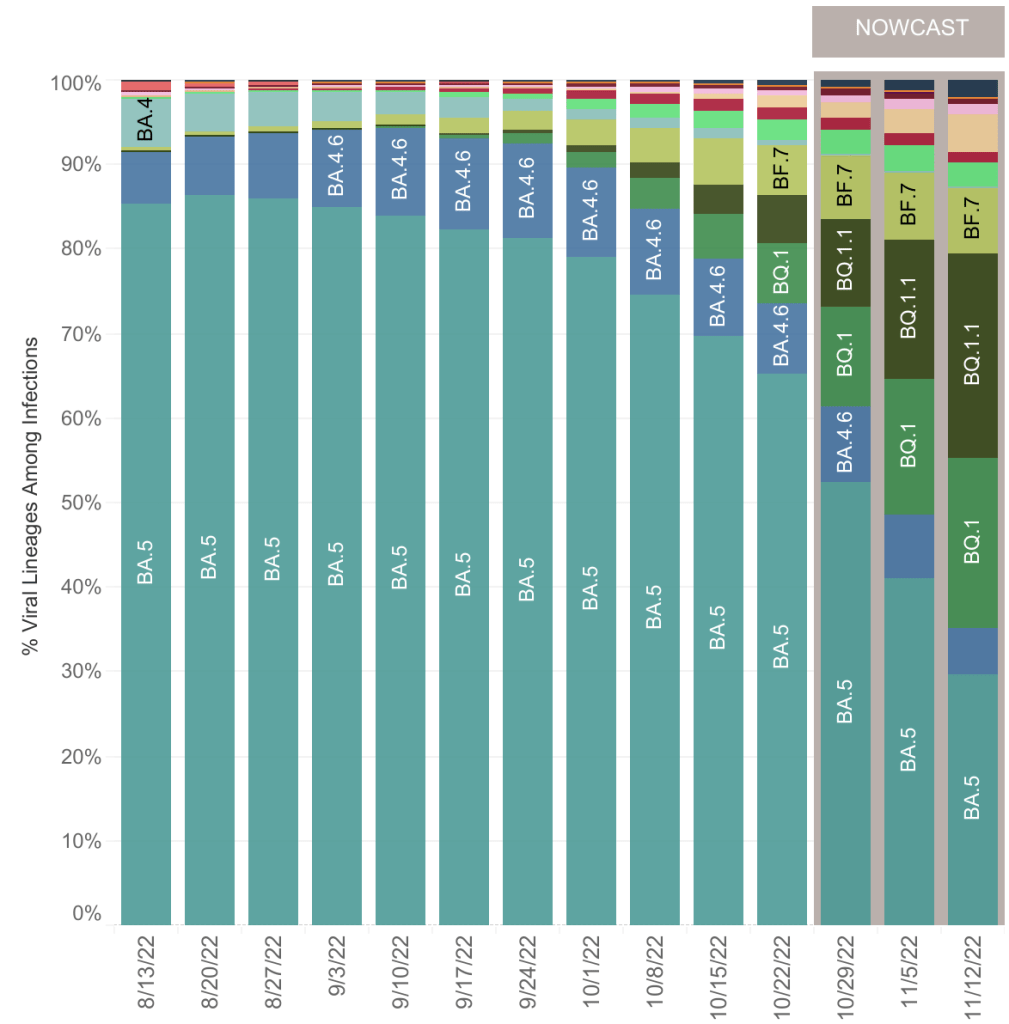
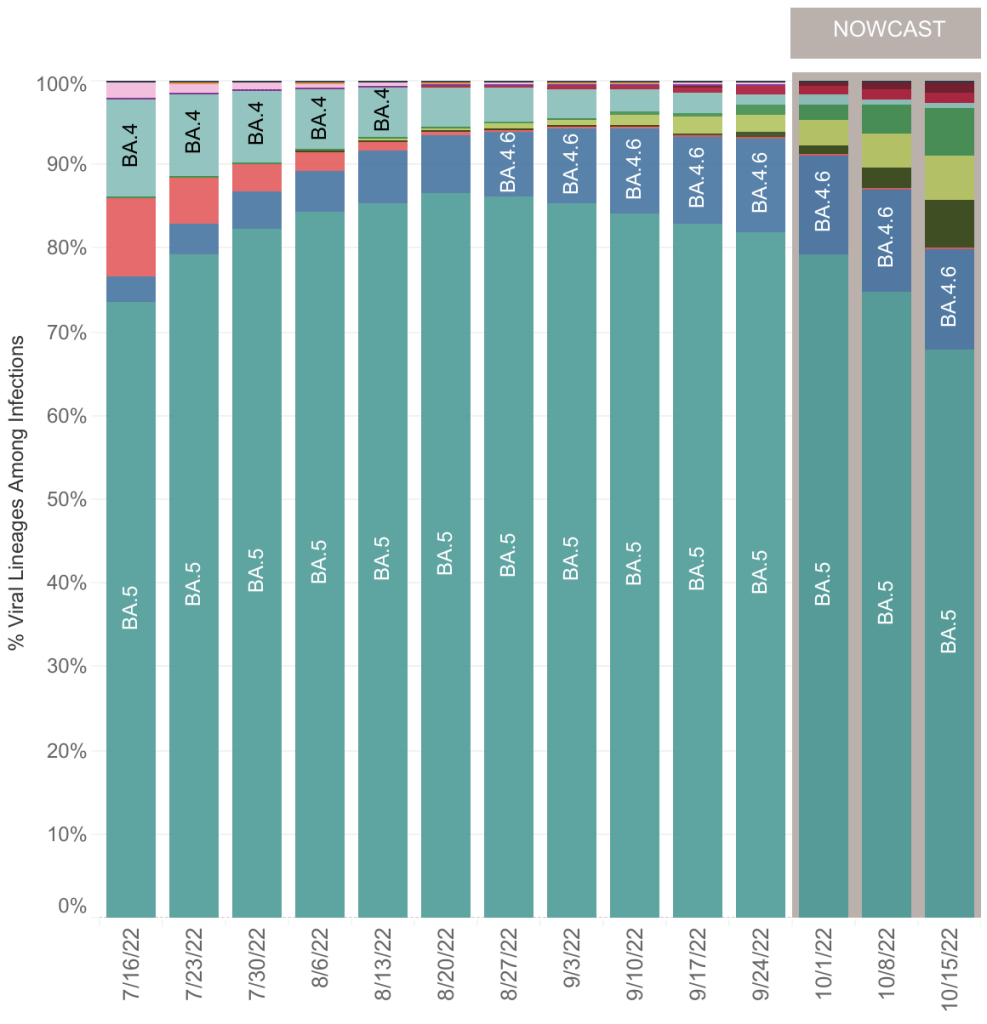
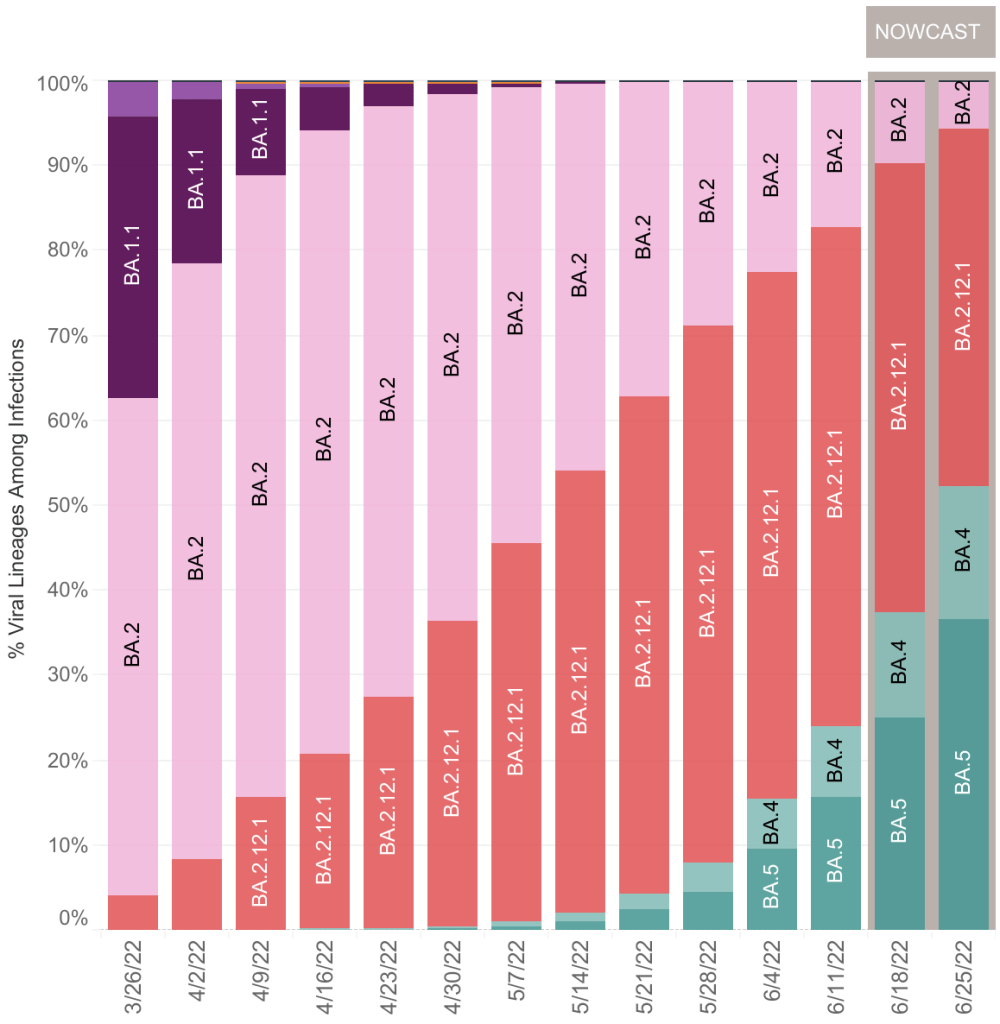
We have generally had single dominant COVID variant in each region, with a few less important versions going around too. In the US, we had Wuhan, then Alpha, Delta, Omicron, then Omicron BA.5. Currently, BA.5 has become a minority variant, with several others growing in prevalence. There is no single variant that dominates, and none are clearly growing faster than others. Importantly, new variants are arising more quickly that our collective immune system can keep up with them, and re-infections are now common. Happily, none of these new variants appear to be very pathogenic, and are not increasing the number of deaths, perhaps because natural immunity against COVID is becoming common.
From the CDC page on Variant Proportions for the United States. Updated on November 12th.From the CDC page on Variant Proportions for the United States. Updated on November 12th.
In light of all this, I’m becoming more convinced that COVID is now endemic, and we won’t get rid of it. Viruses have a tendency to become more infectious and less pathogenic (disease causing) over time, and we’ve certainly seen that happen during COVID. New COVID variants will likely continue this trend. So we most likely will never return to the days when there are very large numbers of COVID hospitalizations and deaths.
Fewer posts from me: During most of the pandemic, I posted every week. In the last few months, I’ve been posting only every 3 weeks or so. Because I believe COVID is now endemic, and most are only minimally concerned, I will probably be posting even less now, only when there is some significant COVID news.
Even though many think the pandemic is basically over in the US, there was still a ton of COVID news this last week. As usual, I’ll tell you what I’m going to talk about in the intro, and you can check the headlines down below to read what interests you. Some sections will be more detailed than many care about, and I have labeled those sections.
This is a COVID case update. I’ll also discuss yet more COVID variants, and a new paper from Greece about vaccines and inflammation. I’ll also discuss a preprint paper from Boston University in which they claim to have created a hybrid SARS-2 virus. Last, I’ll talk about a recent study which sheds some light on the number of people in the US who have actually had COVID as of February.
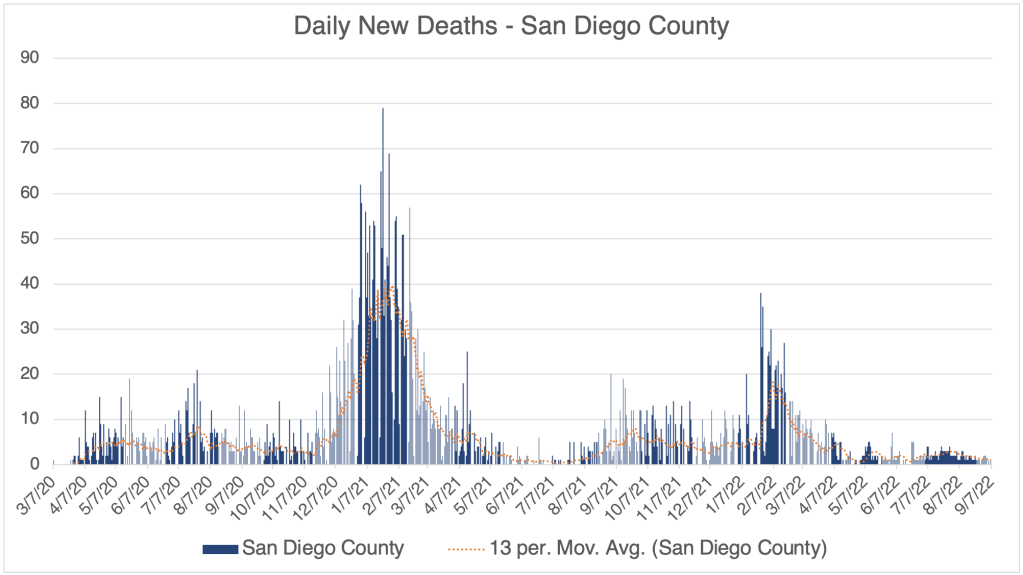
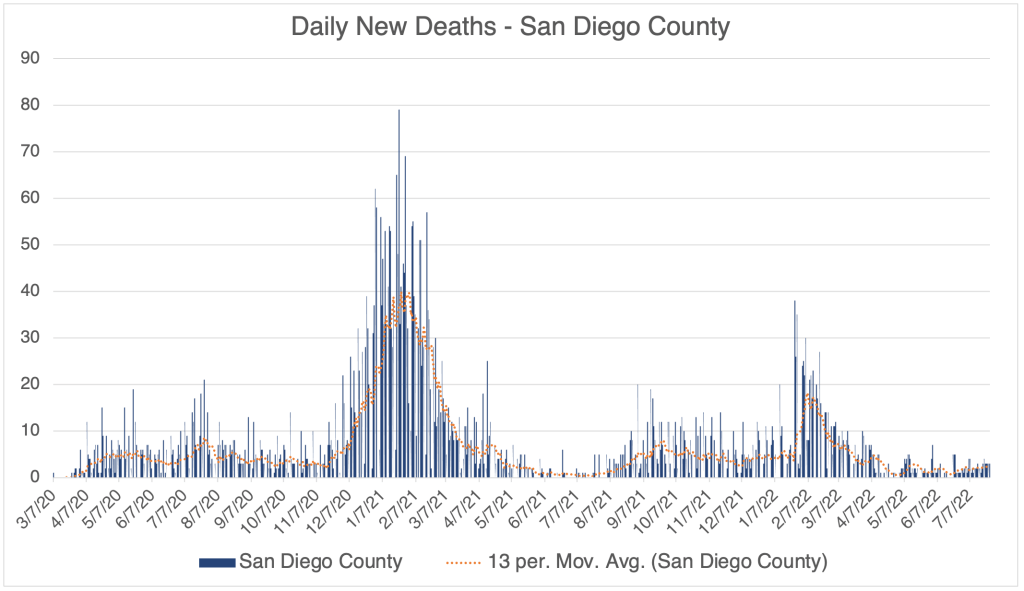
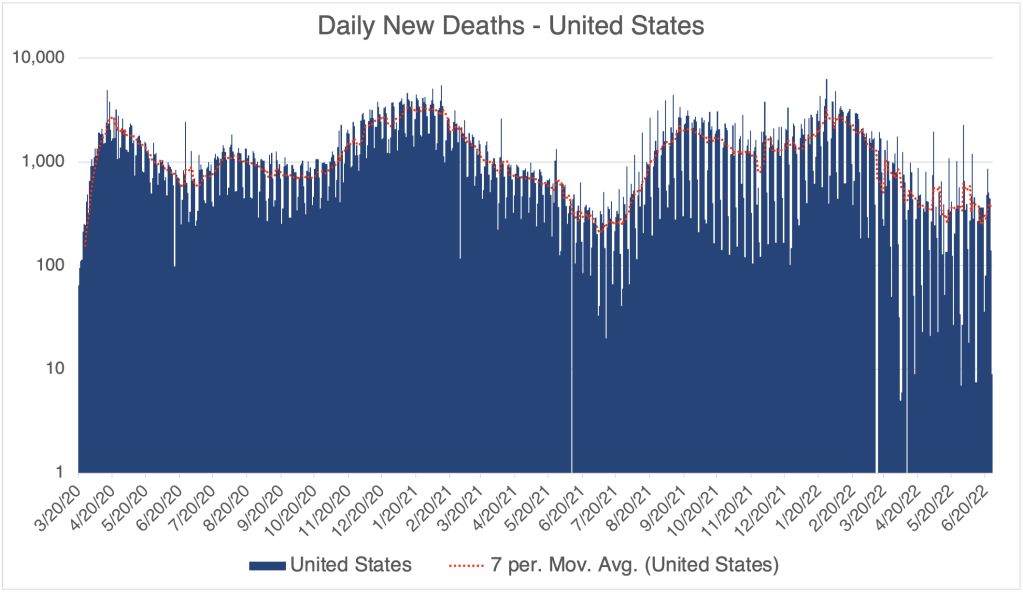
Case Update: Cases continue to go down in the US, California and San Diego County. This has been a steady trend since mid-July. Cases are about the same as in the Spring, before BA.5 arose. Despite several new variants, deaths have not had a new peak, and are still relatively low, but not as low as the Summer of 2021, before the Delta variant arose.
Graph is by me, from data collected from Johns Hopkins University COVID site. Graph is presented in a logarithmic format to emphasize small numbers. Note that each number on the left is 10x higher than the one below it.Graph is by me, from data collected from Johns Hopkins University COVID site. Graph is presented in a logarithmic format to emphasize small numbers. Note that each number on the left is 10x higher than the one below it.Graph is by me, from data collected from Johns Hopkins University COVID site. Graph is presented in a logarithmic format to emphasize small numbers. Note that each number on the left is 10x higher than the one below it.Graph is by me, from data collected from Johns Hopkins University COVID site. Graph is presented in a linear format. Graph is by me, from data collected from San Diego County Public Health. Graph is presented in a logarithmic format to emphasize small numbers. San Diego County now only releases information on Thursday each week. Data points shown are extrapolated using this information.Graph is by me, from data collected from San Diego County Public Health. Graph is presented in a linear format. San Diego County now only releases information on Thursday each week. Data points shown are extrapolated using this information.Hospitalizations in SD County, July 10th to October 10, 2022. Gray area represents time-frame in which data is still being collected. Note that a significant number of hospitalizations are among the vaccinated.Graph is by me, from data collected from Johns Hopkins University COVID site. Graph is presented in a linear format.
New variants: There are more new variants. They continue to follow the trend of being more infectious than previous versions. Some outlets are raising alarms about these new variants (BF.7, BQ.1, XBB), but there is not yet concrete evidence that they are more pathogenic than other recent versions. There was concern that BA.5 was truly more pathogenic than other Omicron versions, but it still didn’t produce a new wave in deaths, perhaps because so many Americans now have either vaccine or natural immunity. How many? See below!
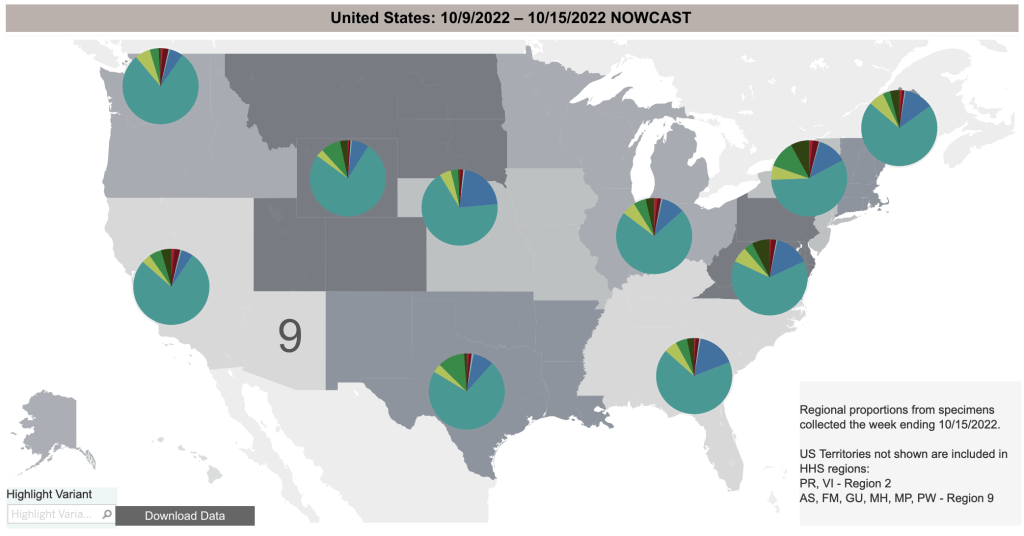
From the CDC page on Variant Proportions for the United States. Updated on October 15th.From the CDC page on Variant Proportions for the United States. Updated on October 15th.From the CDC page on Variant Proportions for the United States, by region. Updated on October 15th.
Spike protein may contribute to adverse events: A July opinion paper from Greece claims that the Spike protein produced by vaccines cause inflammation and may be responsible for adverse events. The paper was published by Cell Press, one of the premiere science journal publishers.
If you’ve been reading my posts for a while, you will know that I first wrote about the link between the Spike protein and adverse events way back July of 2021. For many months, the idea that vaccines were causing a lot of adverse events, and that the Spike protein itself was toxic was considered misinformation by the American medical establishment, yes, even by me. Now this idea is becoming a topic of debate and perhaps even accepted.
If you look up the words “adverse events covid vaccine” on PubMed, the site biologists use to search scientific articles, you will now see dozens of papers linking vaccines, the spike protein, inflammation, and adverse events. Sorry, I still do not know just how many adverse events there are, as this information has not been adequately collected and/or shared by the CDC.
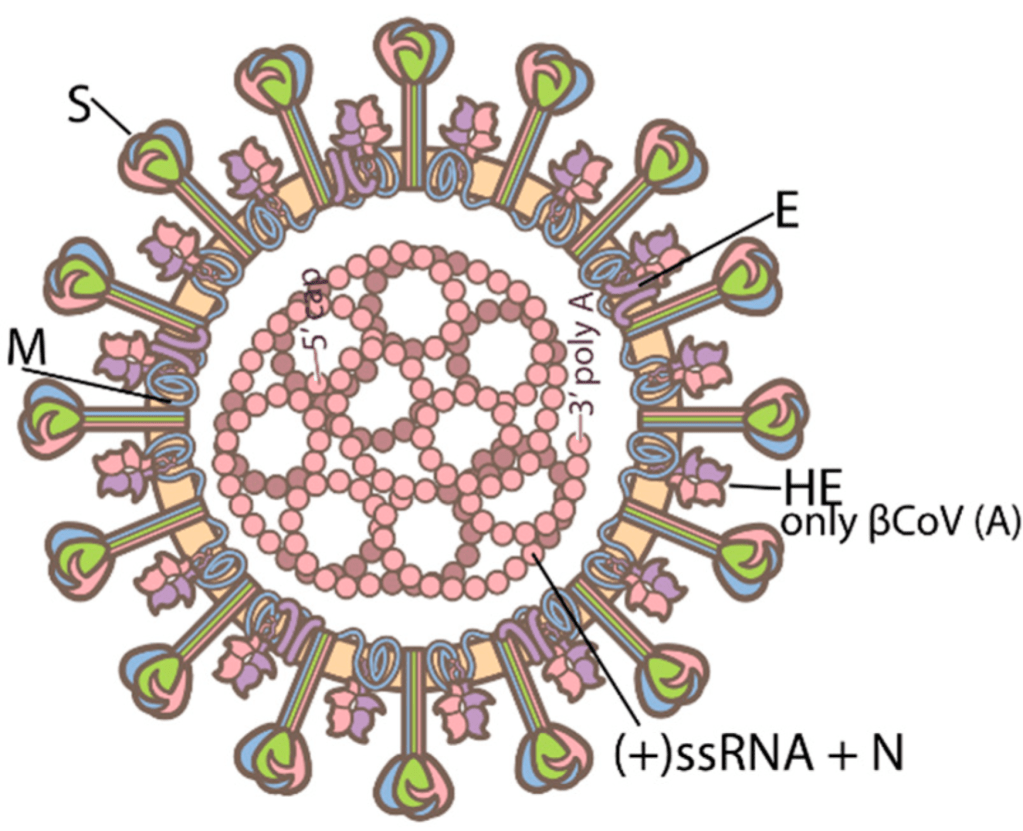
Details: Many scientists are now suggesting that the vaccine should have used the Nucleocapsid protein rather than the Spike protein. Nucleocapsid is a SARS-2 protein that helps package the RNA genome. It does not change as rapidly as the Spike protein and does not interact directly with human proteins, so is not toxic. For these reasons, it would have been safer to use the Nucleocapsid protein instead.
Structure of SARS-2. Spike is the tall outer protein, Nucleocapsid is the internal pink protein. From Sriwilaijaroen, N.; Suzuki, Y. Host Receptors of Influenza Viruses and Coronaviruses—Molecular Mechanisms of Recognition.
The downside is that a vaccine using Nucleocapsid would not have prevented initial infection. Why would it have been useful then? When the immune system destroys a virus, proteins from the virus end up getting displayed on the outside of cells, either infected cells, or immune cells. This gives the immune system a chance to either detect these viral proteins and use them or make antibodies, or as a signal that a cell is infected and needs to be destroyed.
If the Nucleocapsid protein were used in a vaccine, SARS-2 could still infect human cells, since Nucleocapsid is inside the virus where the immune system can’t see it. However, after a cell is infected, it displays Nucleocapsid on the outside. If a person is immunized, immune cells will detect these proteins and destroy the infected cell. While using Nucleocapsid in a vaccine wouldn’t prevent infection, it would probably greatly reduce viral load and symptoms.
Keep in mind that this is Monday morning quarterbacking. Scientists didn’t know that the Spike protein itself was toxic when they created the vaccines, and internal viral proteins aren’t generally used in vaccines, so it didn’t occur to anyone to do this at the time. It is being discussed now, though, and may change vaccine design in the future.
Of course, we all now know that the Spike vaccines did not prevent infection by the Delta and Omicron variants.
Hybrid SARS-2 Virus Created in the Lab: This Monday, a lab at Boston University reported that they had created a strain of SARS-2 virus that killed 80% of infected mice. The internet freaked out and subsequent reports said that it wasn’t all that bad, etc. So I wanted to discuss this paper, tell you want exactly they did, and what I think about it. There will be some detail, but I’ll give you a summary at the end if you want to skip to that.
The Boston group led by Mohsan Saeed took the Spike protein from an Omicron variant, and knitted it into the backbone of the original Wuhan virus. The goal was to see what made the Wuhan virus more pathogenic, and the Omicron virus less pathogenic. Was it the Spike protein, which determines transmissibility, or the internal viral proteins which determine other factors like how fast it replicates in a cell.
The resulting virus, called Omi-S was in fact much more pathogenic than Omicron, but not as pathogenic as the original Wuhan strain. In the now infamous 80% kill rate experiment, it is important to know that the mice were infected in a very efficient manner, so that they were likely to have a severe case. Also, the ancestral Wuhan strain killed 100% of these mice (6 mice died out of 6 mice tested). The Omicron strain killed 0%. So if Omi-S were to escape into the population, it wouldn’t kill 80% of the population, only 80% of the number that Wuhan killed. So if Wuhan killed 1 – 3% of victims, Omi-S might only kill 0.8 – 2.4%. Using several measures, Omi-S was much more pathogenic than Omicron, but less pathogenic than the Wuhan strain.
On the other hand, Omicron was well known to be much more transmissible than the Wuhan strain. Presently, even countries that did well early in the pandemic have been unable to control Omicron and have experienced big outbreaks this year. So it is likely that Omi-S could spread extremely rapidly, and still kill more people than the original Wuhan strain.
So was this result worth the risk? Most infectious disease scientists know that the 1918 flu was so dangerous not just because of its unique surface proteins, but also because the internal proteins were especially robust. The result with Omi-S paper shows much the same thing. To me, the paper gave a result which was unsurprising. Scientists will disagree on whether this new variant should have been created. In my view, it was not worth the risk to create such a potentially dangerous variant to get a “water is wet” result.
Does Omi-S still pose a threat? Experiments like this in the US are usually monitored by the CDC or other agencies. Labs are generally required to destroy dangerous agents when the experiment is over. It is likely that Omi-S no longer exists. But given the unintentional release of SARS-2 in the first place, I think Americans may feel justified in being a little nervous about these experiments.
As an aside, in many infectious disease experiments, scientists go through a lot of effort to create test viruses or bacteria that cannot survive outside the lab environment. They do this by making versions that are incomplete, or need to be provided specific nutrients to survive.
Summary of the Hybrid SARS-2 virus: The Boston lab created a virus that combined the internal workings of the more pathogenic Wuhan strain with the more transmissible Omicron Spike protein. They found that the internal proteins were likely responsible for the higher pathogenicity of the Wuhan strain. In light of what is known about the 1918 flu virus, this result is not surprising. While this hybrid virus likely no longer exists, my view is that the incremental knowledge gained was not worth the risk of creating this strain.
Headlines that the virus killed 80% of mice were true but misleading. Under the conditions of the experiment, 80% of mice were killed by the new virus, but 100% of mice were killed by the original Wuhan strain. So this virus would be approximately 80% as deadly in infected people as the Wuhan strain.
How many people have had SARS? The CDC published a paper in April describing “Seroprevalence” in the American population. “Seroprevalence” basically means the number of people who have antibodies for a particular virus. The study detected antibodies against the Nucleocapsid protein in patients between September 2021 and February 2022. They did not have a random sample of patients, but rather used lab samples gathered when the people tested went to the doctor for any reason. So the subjects were skewed to people who were sicker or otherwise more engaged with health care than others.
Because they detected antibodies against Nucleocapsid and not Spike, the study did not detect vaccinated people, only those who have had COVID. Interestingly, the results showed that 75% of children up to 11 have had COVID, and the number was lower in each higher age group. Of those 65 and older, only 33% have had COVID.
This is a case update. I’ll also comment on new variant, new boosters, and the President’s announcement that the pandemic is over.
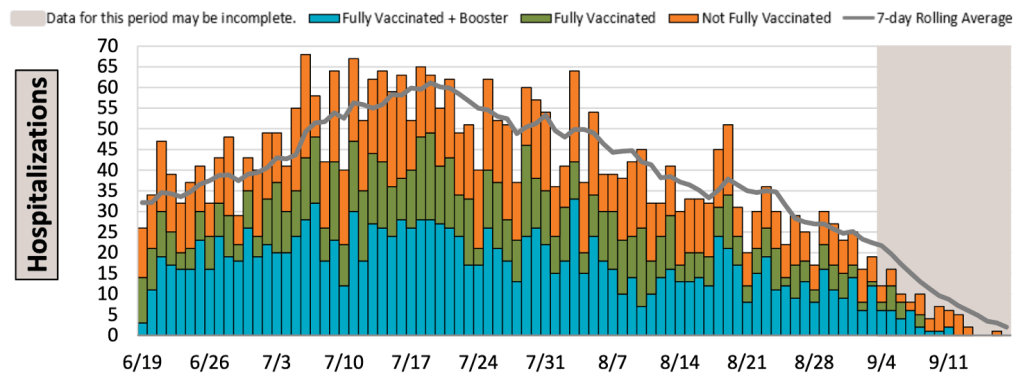
Cases continue to go down in the US, California and San Diego County. Again, since most people are now testing themselves using over the counter tests, the official case numbers are probably a gross underestimation of actual cases. Hospitalizations are a better measure, and they are also going down.
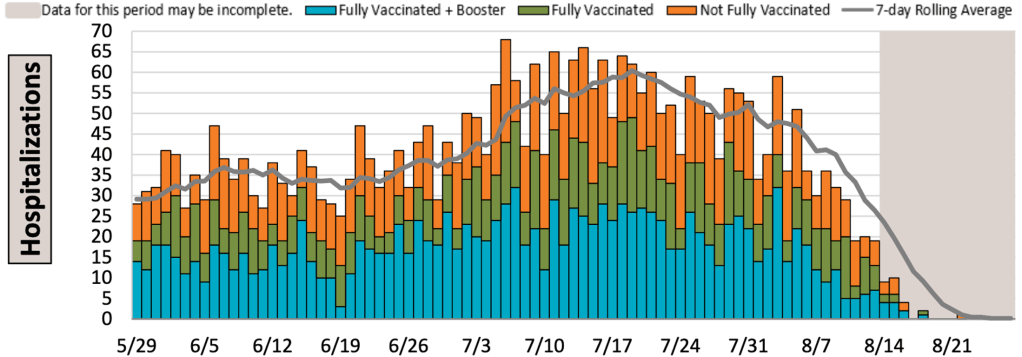
Graph is by me, from data collected from Johns Hopkins University COVID site. Graph is presented in a logarithmic format to emphasize small numbers. Note that each number on the left is 10x higher than the one below it.Graph is by me, from data collected from Johns Hopkins University COVID site. Graph is presented in a logarithmic format to emphasize small numbers. Note that each number on the left is 10x higher than the one below it.Hospitalizations, from the CDC website.Graph is by me, from data collected from Johns Hopkins University COVID site. Graph is presented in a logarithmic format to emphasize small numbers. Note that each number on the left is 10x higher than the one below it.Graph is by me, from data collected from Johns Hopkins University COVID site. Graph is presented in a logarithmic format to emphasize small numbers. Note that each number on the left is 10x higher than the one below it.Graph is by me, from data collected from San Diego County Public Health. Graph is presented in a logarithmic format to emphasize small numbers. San Diego County now only releases information on Thursday each week. Data points shown are extrapolated using this information.Graph is by me, from data collected from San Diego County Public Health. Graph is presented in a linear format. San Diego County now only releases information on Thursday each week. Data points shown are extrapolated using this information.Hospitalizations in SD County, June 19th to September 14, 2022. Gray area represents time-frame in which data is still being collected. Note that a significant number of hospitalizations are among the vaccinated.
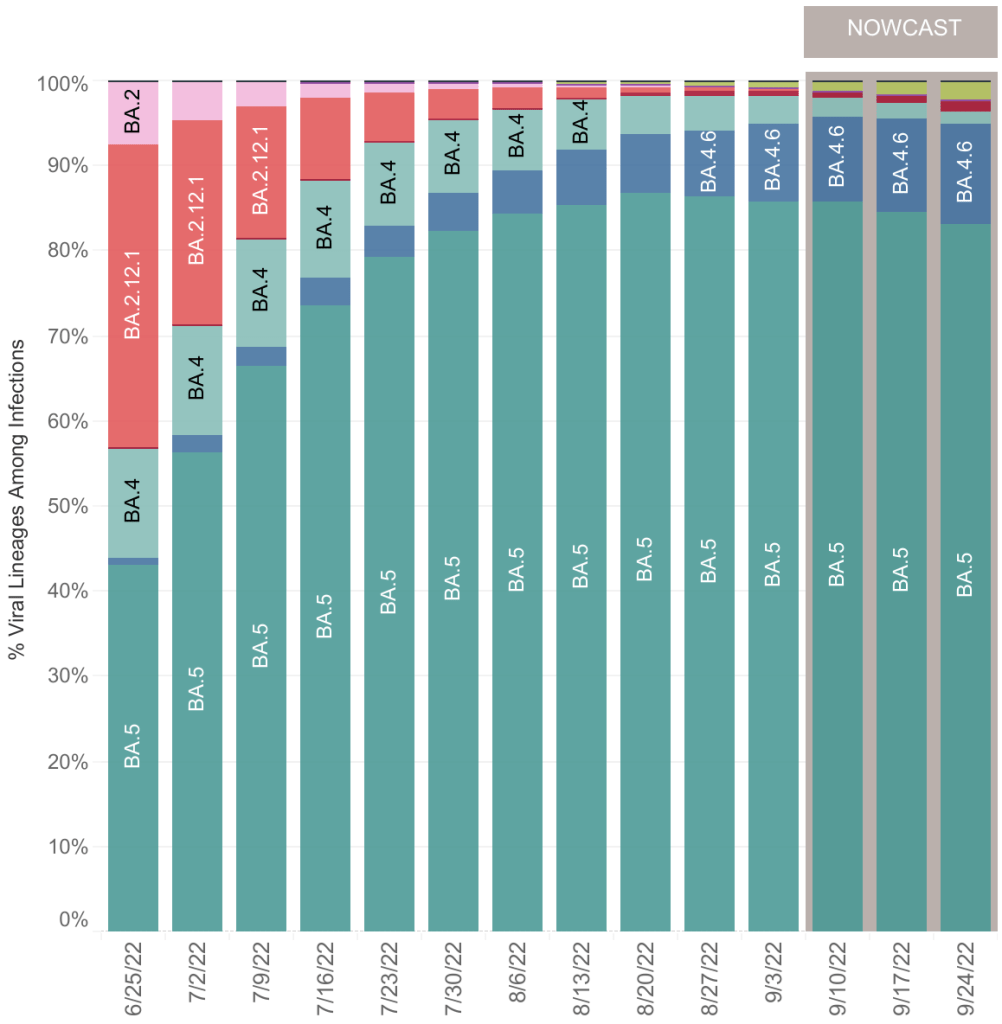
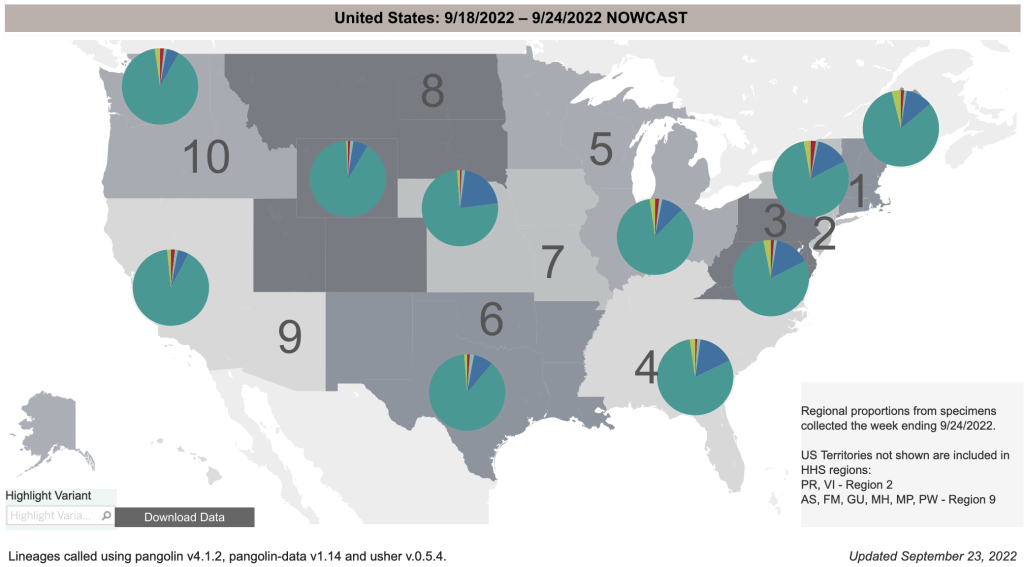
Variants BA.4.6 and BF.7: In my last post, I introduced a new variant BA.4.6. While hospitalizations are down, this new variant is now 11% of COVID cases in the US, and 20% of cases in the Midwest. Still, I don’t think this new variant is likely to have a big impact on the pandemic at the moment, and I expect cases to continue to go down. Deaths remain relatively low compared to the Omicron variant in April after the Winter wave. A newer variant, BF.7, is already growing in prevalence, but so far, there isn’t a lot of news about it.
From the CDC page on Variant Proportions for the United States. Updated on September 24th.From the CDC page on Variant Proportions. Updated on September 24th. Notice that BA.4.6 (dark blue wedge) is most prominent in the Midwest.From the CDC page on Variant Proportions for the Midwest. Updated on September 24th.
New boosters including Omicron strains: In August, the FDA announced emergency authorization of new boosters by Pfizer, Moderna, and Novavax. This new class of boosters produces spike proteins from the original Wuhan strain, but also from Omicron variants BA.4 and BA.5. People have been asking me my opinion about these new boosters. To preface my comments, I’ll say again that I am not a physician, epidemiologist, or immunologist, so my opinion is informed but not expert.
While the inclusion of BA.4 and BA.5 targets will make these new boosters an improvement over previous versions, I think most people will not benefit from them. For anyone who has had COVID, which is now arguably most of us, they will not really benefit you. Natural immunity has been shown in many studies to be equal or superior to vaccine mediated immunity in preventing infection and severe disease.
If you have never had COVID, you may benefit from the new booster. Keep in mind however that we have never really gotten clear data about adverse events after vaccination. In fact, Pfizer documents suggest that adverse events have been much more numerous than have been officially acknowledged. The new boosters have not yet been FDA cleared, and according to a video by John Campbell, Pfizer’s testing only included eight mice in their testing group. No human testing has yet been performed. Because variants are arising so quickly these days, I think the usefulness of new boosters is effectively over.
I suggested that my own parents get vaccinated in the Spring of 2021. But I am not suggesting that they receive the new booster. If you do choose to get the new booster, try and find a provider who will aspirate before injection.
President Biden announces that the pandemic is over: On September 19, CBS News released a video in which President Biden stated that the pandemic is over. In the interview, the President said “The pandemic is over. We still have a problem with COVID. We’re still doing a lotta work on it. … But the pandemic is over.” Of course, this triggered a debate on whether the pandemic is really over. At least a few health care officials said the health crisis is still ongoing, and that caution is still warranted. Debates are now ongoing as to the appropriateness of ongoing emergency measures like vaccine mandates and emergency use authorizations.
As for me personally, I had difficult time with COVID in January, and a much more mild case in July. I am basically behaving normally at this point. Most places I go, even in California, are basically going back to normal.
On other hand, hospitals are still seeing COVID patients and laboratories are still doing lots of COVID testing, so for them, COVID is still a reality they have to deal with.
If you’ve never had COVID, I would still recommend wearing a high quality medical respirator indoors in public (N95, KN95, or KF94). Blue surgical and cloth masks are not effective against Omicron variants.
This is a COVID case update. I’ll also have a brief warning about Hurricane Kay, which I’ve heard very little about in the news.
Confirmed cases continue to decrease in the US, California, and San Diego County. Hospitalizations are down too, especially in San Diego County.
Graph is by me, from data collected from Johns Hopkins University COVID site. Graph is presented in a logarithmic format to emphasize small numbers. Note that each number on the left is 10x higher than the one below it.Graph is by me, from data collected from Johns Hopkins University COVID site. Graph is presented in a logarithmic format to emphasize small numbers. Note that each number on the left is 10x higher than the one below it.Hospitalizations, from the CDC website.Graph is by me, from data collected from Johns Hopkins University COVID site. Graph is presented in a logarithmic format to emphasize small numbers. Note that each number on the left is 10x higher than the one below it.Graph is by me, from data collected from Johns Hopkins University COVID site. Graph is presented in a linear format.Graph is by me, from data collected from San Diego County Public Health. Graph is presented in a logarithmic format to emphasize small numbers. San Diego County now only releases information Monday and Thursday each week. Data points shown are extrapolated using this information.Graph is by me, from data collected from San Diego County Public Health. Graph is presented in a linear format. San Diego County now only releases information Monday and Thursday each week. Data points shown are extrapolated using this information.Hospitalizations in SD County, May 29th to August 21st, 2022. Gray area represents time-frame in which data is still being collected. Note that a significant number of hospitalizations are among the vaccinated.Graph is by me, from data collected from Johns Hopkins University COVID site. Graph is presented in a linear format.
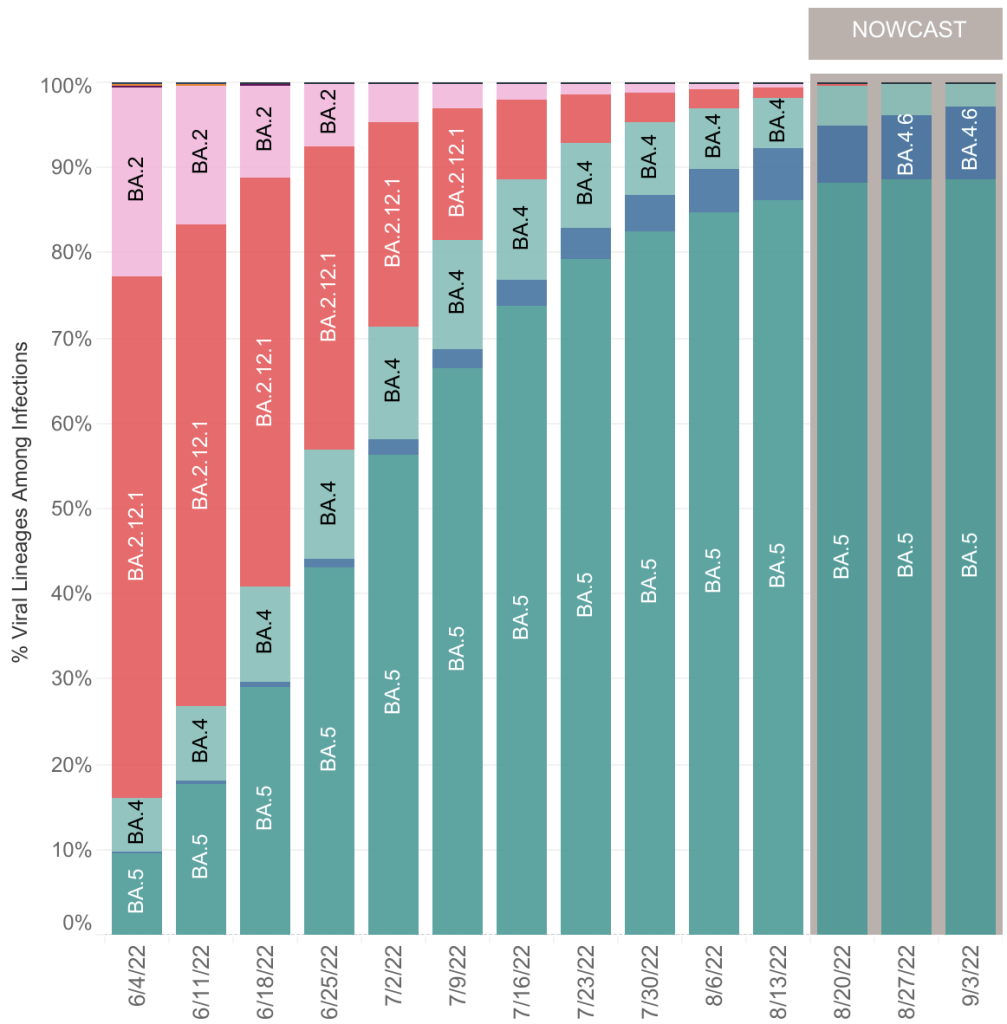
A newly recognized variant, BA.4.6 is growing relative to BA.5, so is likely more infectious. I haven’t been able to determine from news stories if it is more or less pathogenic (disease causing) than BA.5. BA.5 never caused an increase in deaths, despite it being more dangerous than previous Omicron strains.
From the CDC page on Variant Proportions. Updated on September 3rd.From the CDC page on Variant Proportions. Updated on September 3rd. Most BA.4.6 cases are in the center and East Coast of the country.
My guess is that BA.4.6 will be less dangerous than BA.5, and that we’ll see fewer hospitalizations and deaths. This is just my speculation at this point.
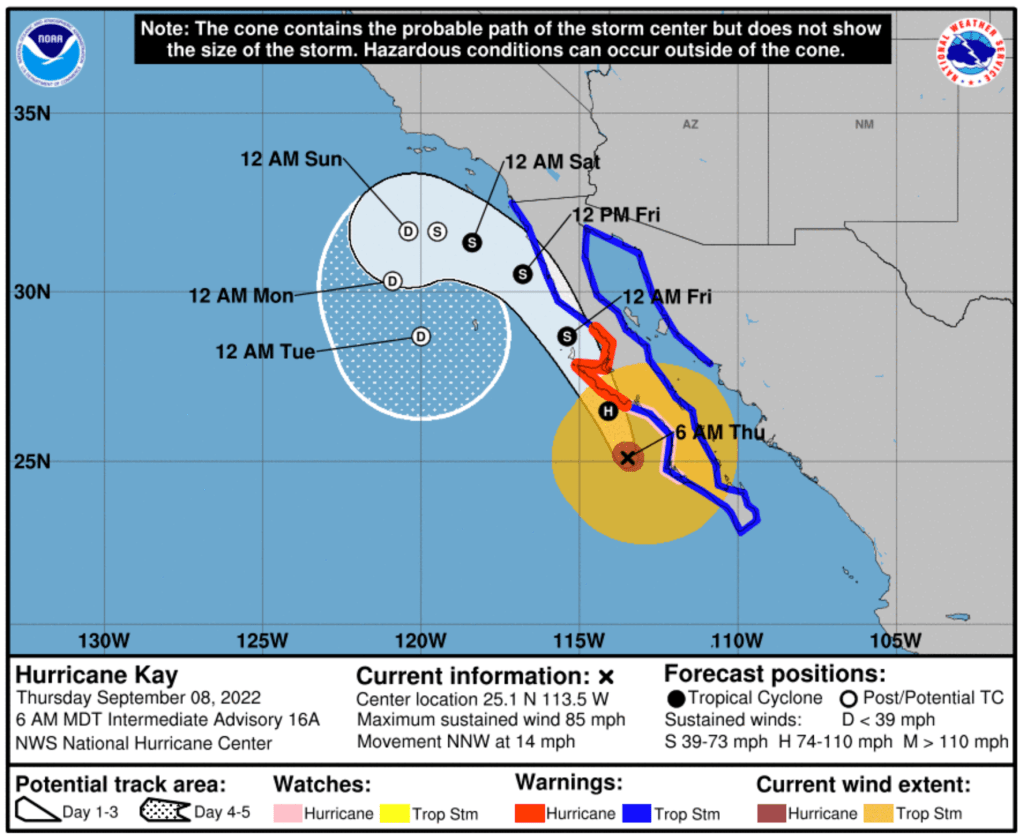
Important Hurricane Kay warning for San Diego: Last weekend and this week, our increased heat and humidity was caused by Tropical Storm Javier, which traveled up the coast just west of Baja California before heading out to sea. Following closely after is Kay, currently a Hurricane off of Southern Baja. Kay will likely get much closer to San Diego than Javier did. San Diego is likely to see rain and even winds up to 23 miles and hour on Friday, according to the Weather Channel on Thursday morning. Kay will likely be downgraded to Tropical Storm by the time it gets to the waters West of San Diego, but it will still likely bring rain and stronger than normal winds. Consider securing loose items like patio furniture, tarps, and garden gnomes. No one likes a flying garden gnome.
National Oceanic and Atmospheric Administration site on Hurricane Kay, accessed at 7:30, Thursday Morning, September 8.
This is a COVID case update. I’ll also discuss the CDC’s recent changes in policy.
We have some good news this week. New cases are going down by every available metric. New confirmed case numbers are coming down in all 3 regions. More importantly, hospitalizations are coming down as well, sharply in San Diego County. BA.5 continues to be the most common variant in the US by far. BA.5 was feared to be more dangerous than previous variants, but deaths have not risen significantly since BA.5 appeared.
Graph is by me, from data collected from Johns Hopkins University COVID site. Graph is presented in a logarithmic format to emphasize small numbers. Note that each number on the left is 10x higher than the one below it.Graph is by me, from data collected from Johns Hopkins University COVID site. Graph is presented in a logarithmic format to emphasize small numbers. Note that each number on the left is 10x higher than the one below it.Hospitalizations, from the CDC website.Graph is by me, from data collected from Johns Hopkins University COVID site. Graph is presented in a logarithmic format to emphasize small numbers. Note that each number on the left is 10x higher than the one below it.Graph is by me, from data collected from Johns Hopkins University COVID site. Graph is presented in a linear format.Graph is by me, from data collected from San Diego County Public Health. Graph is presented in a logarithmic format to emphasize small numbers. San Diego County now only releases information Monday and Thursday each week. Data points shown are extrapolated using this information.Graph is by me, from data collected from San Diego County Public Health. Graph is presented in a linear format. San Diego County now only releases information Monday and Thursday each week. Data points shown are extrapolated using this information.Hospitalizations in SD County, May 22nd to August 14th, 2022. Gray area represents time-frame in which data is still being collected. Note that a significant number of hospitalizations are among the vaccinated.
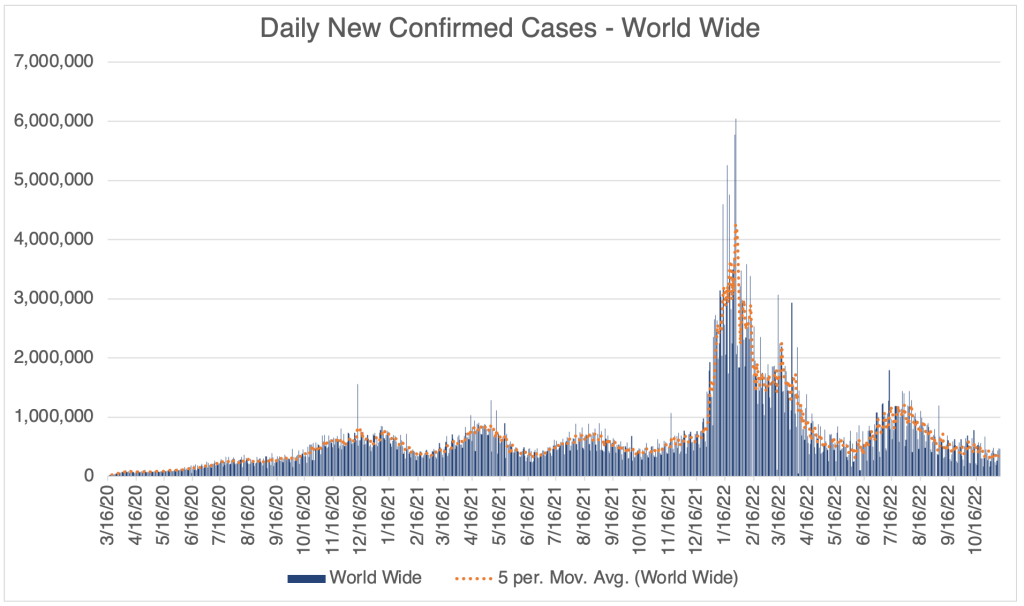
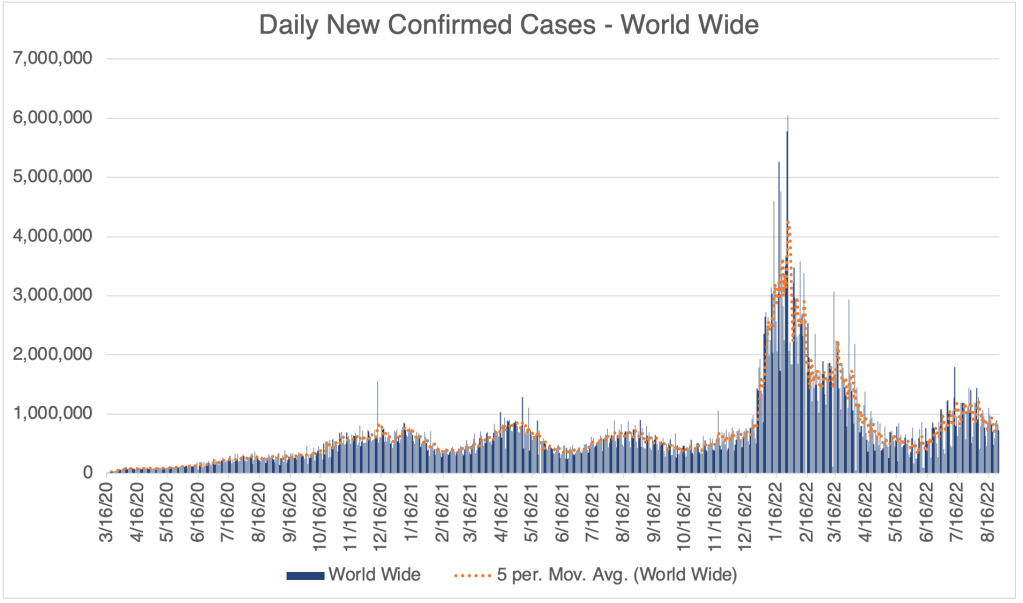
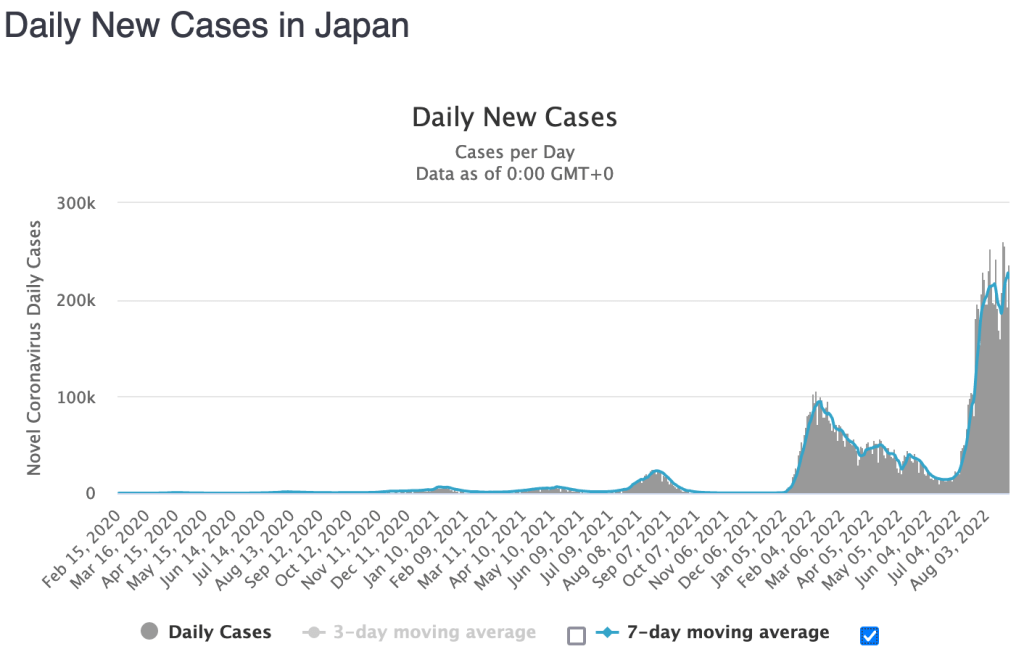
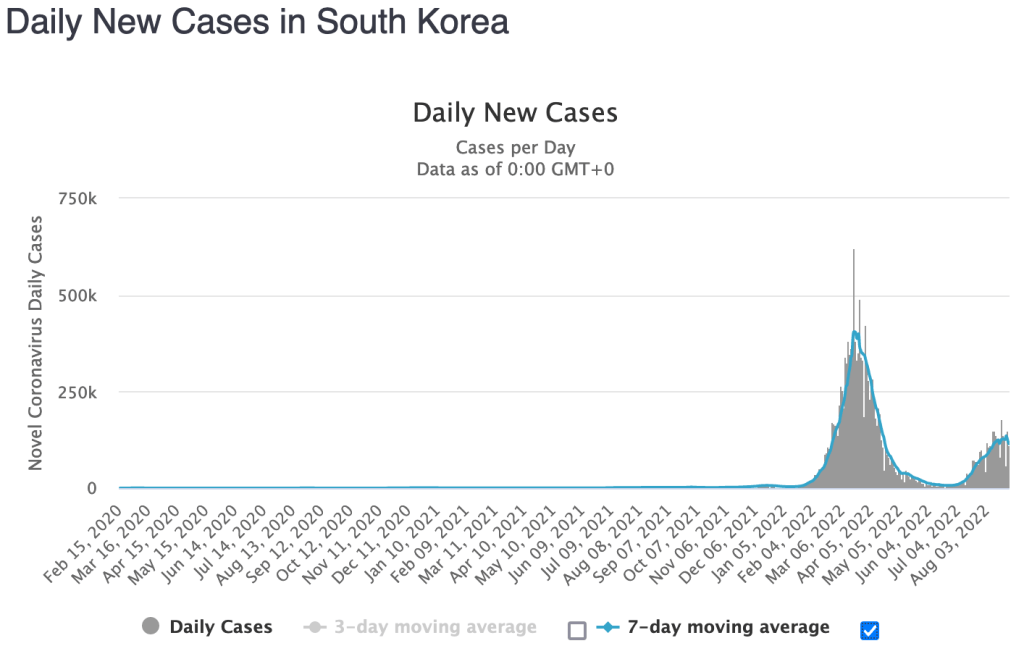
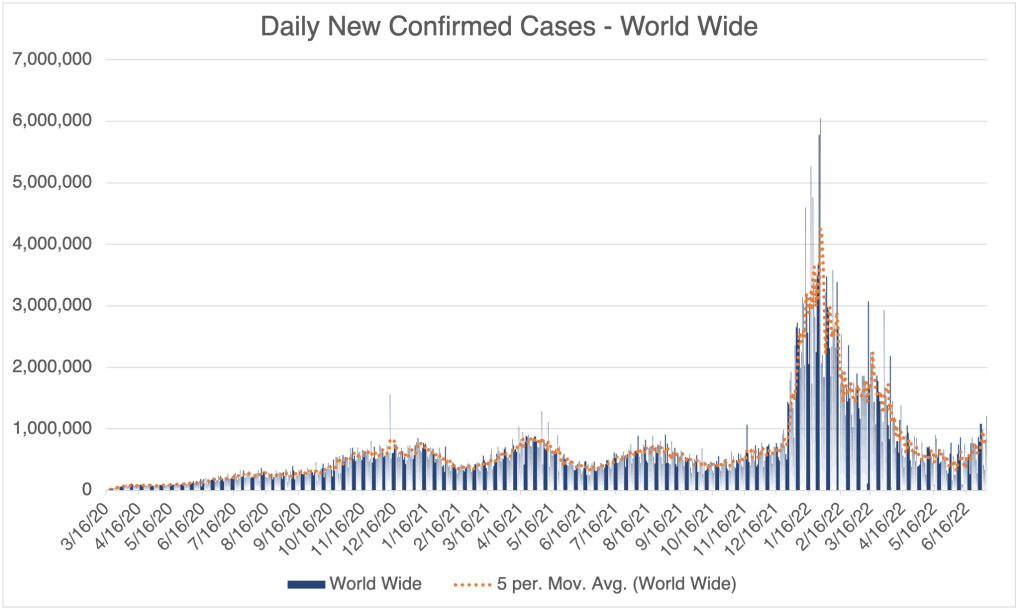
World wide, new cases are coming down. After spending most of the pandemic at the top of the list of countries with the most new cases, the US is now at #3 on John’s Hopkins list, behind both Japan and South Korea, and at #7 on Worldometer’s list. Sorry, the US still has double as many total cases as #2, India.
I’ve discussed several times before that the CDC is primarily responsible for the poor US response to the pandemic. Even worse, they have done great damage to the public’s trust in the medical community and in science in general. I’m glad she intends to fix the agency, but I’m afraid this will not be a speedy process and may essentially be impossible. In order to be successful, they will need to be transparent, and probably fire some people top leadership in order to regain the public’s trust.
• Those exposed to COVID need not quarantine. Test on day 5, and wear a mask in public for 10 days.
• If you test positive for COVID, quarantine for 5 days. If after 5 days you are fever-free for 24 hours without the use of medication, and your symptoms are improving, or you never had symptoms, you may end isolation after day 5. Wear a mask until day 11, and stay away from high risk people.
• Vaccinated and unvaccinated people will not be treated differently.
Some of these changes are in response to the improving situation, while others are long overdue.
If you think you may have been exposed to COVID, review the changes on the CDC website.
This is a case update. I’ll also have an update on the Monkeypox epidemic.
Not much has changed in the last 2 and a half weeks. Cases are still at a moderate level, at least according to official case numbers in the US, California and San Diego County. However, deaths in all 3 regions are still relatively low. This situation has persisted since early May. Even the more dangerous BA.5 has not really produced a large increase in official cases.
Graph is by me, from data collected from Johns Hopkins University COVID site. Graph is presented in a logarithmic format to emphasize small numbers. Note that each number on the left is 10x higher than the one below it.Graph is by me, from data collected from Johns Hopkins University COVID site. Graph is presented in a logarithmic format to emphasize small numbers. Note that each number on the left is 10x higher than the one below it.Graph is by me, from data collected from Johns Hopkins University COVID site. Graph is presented in a logarithmic format to emphasize small numbers. Note that each number on the left is 10x higher than the one below it.Graph is by me, from data collected from Johns Hopkins University COVID site. Graph is presented in a linear format.Graph is by me, from data collected from San Diego County Public Health. Graph is presented in a logarithmic format to emphasize small numbers. San Diego County now only releases information Monday and Thursday each week. Data points shown are extrapolated using this information.Graph is by me, from data collected from San Diego County Public Health. Graph is presented in a linear format. San Diego County now only releases information Monday and Thursday each week. Data points shown are extrapolated using this information.
Most people are not getting tested in a medical setting right now, preferring to test themselves with over the counter antigen tests. As I posted a few weeks ago, these tests are producing a lot of false negatives right now, so many with COVID think they just have a cold. I believe I had COVID in mid July, but I tested negative twice, and never tested positive.
A better measure of case load is hospitalizations. In the US, hospitalizations likely peaked just a few weeks ago, and are now headed down. In San Diego County, hospitalizations likely peaked on around July 10th.
Right now, 89% if the COVID in the US is of the BA.5 variant. This variant is theoretically more dangerous than previous Omicron variants, but has not had a large impact, likely because of a lot of immunity in the population, either vaccine or naturally acquired. As for me, my case in January was much more severe than my case in July, despite my case in July being a more “dangerous” variant.
Most in the public are acting as if the pandemic is basically over. For the vast majority, there is really no longer a danger of severe disease or death. If you have not yet had COVID, you may still want to take precautions to prevent infection. Wear a medical respirator (N95, KN95, or KF94) when indoors in public.
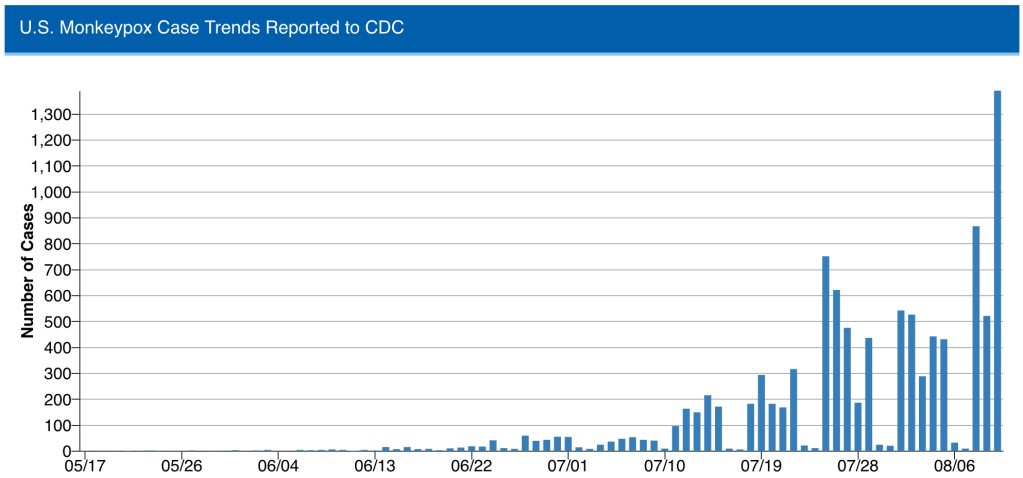
Monkeypox Update: Despite being only moderately infectious, Monkeypox has continued to spread in many countries. There are now 11,000 confirmed cases in the US. The disease is similar to Smallpox, but is much less severe. It is spread primarily by skin to skin contact. With medical attention, Monkeypox is very rarely fatal, with currently only 3 fatalities in Europe. Monkeypox is endemic in central Africa, and occasionally produces outbreaks.
Monkeypox virus has been found on surfaces and in airborne droplets, so it is theoretically possible to contract it via these routes. However, there have been no confirmed cases of airborne transmission in the UK, according to a UK government document.
Some people living with infected persons have also contracted Monkeypox, so it appears that prolonged indirect contact can also spread this disease.
At the moment, 95.3% of cases in the UK are in a category called “men who have sex with men” (MSM), and this rate is likely similar in the US, but if cases continue to go up in the US, we will likely see more cases in the broader community. The good news is, new daily cases in the UK peaked in early July and are coming down now, so the US will likely start seeing a reduction in cases soon. Hopefully, the Monkeypox epidemic will be short lived.
A note on symptoms. Most of the public and even physicians assume that Monkeypox produces boils similar to smallpox or chickenpox. While it often does, it commonly seems to produce small rashes instead, leading to misdiagnosis. So if you or someone you know has small rashes, they should assume Monkeypox, isolate themselves, and seek medical attention. Smallpox vaccine appears to be effective against Monkeypox, so a vaccine is already available, but it is in short supply right now.
This is a COVID update. I’ll also briefly discuss a mystery from a few months ago, a hepatitis in children of unknown cause.
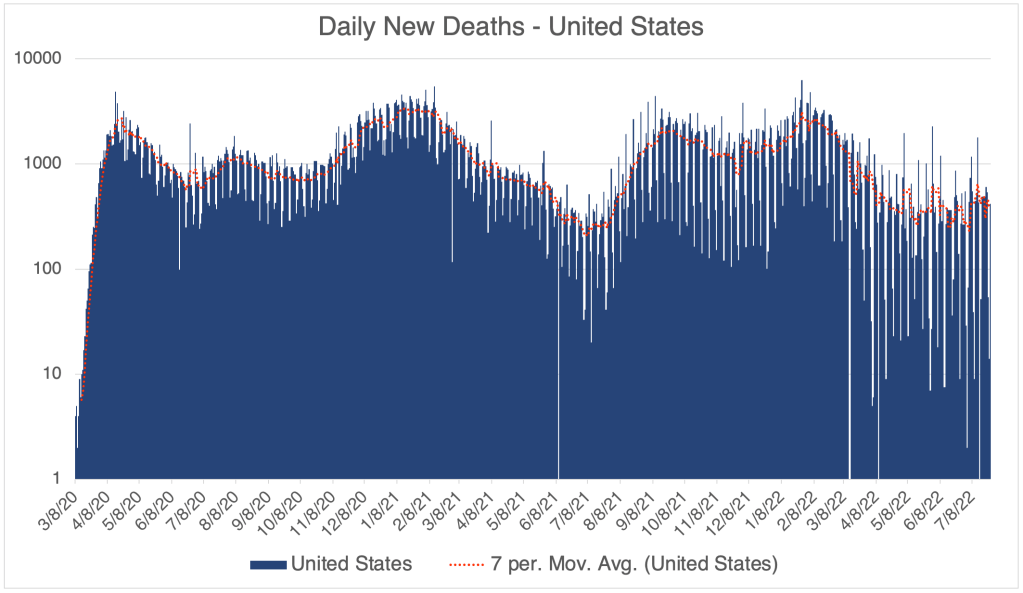
It’s been almost 3 weeks since my last post. Since then, we’ve seen remarkably little change in either infections or deaths in the US, California, or San Diego County.
Graph is by me, from data collected from Johns Hopkins University COVID site. Graph is presented in a logarithmic format to emphasize small numbers. Note that each number on the left is 10x higher than the one below it.Graph is by me, from data collected from Johns Hopkins University COVID site. Graph is presented in a logarithmic format to emphasize small numbers. Note that each number on the left is 10x higher than the one below it.Graph is by me, from data collected from Johns Hopkins University COVID site. Graph is presented in a logarithmic format to emphasize small numbers. Note that each number on the left is 10x higher than the one below it.Graph is by me, from data collected from Johns Hopkins University COVID site. Graph is presented in a linear format.Graph is by me, from data collected from San Diego County Public Health. Graph is presented in a logarithmic format to emphasize small numbers. San Diego County now only releases information Monday and Thursday each week. Data points shown are extrapolated using this information.Graph is by me, from data collected from San Diego County Public Health. Graph is presented in a linear format. San Diego County now only releases information Monday and Thursday each week. Data points shown are extrapolated using this information.
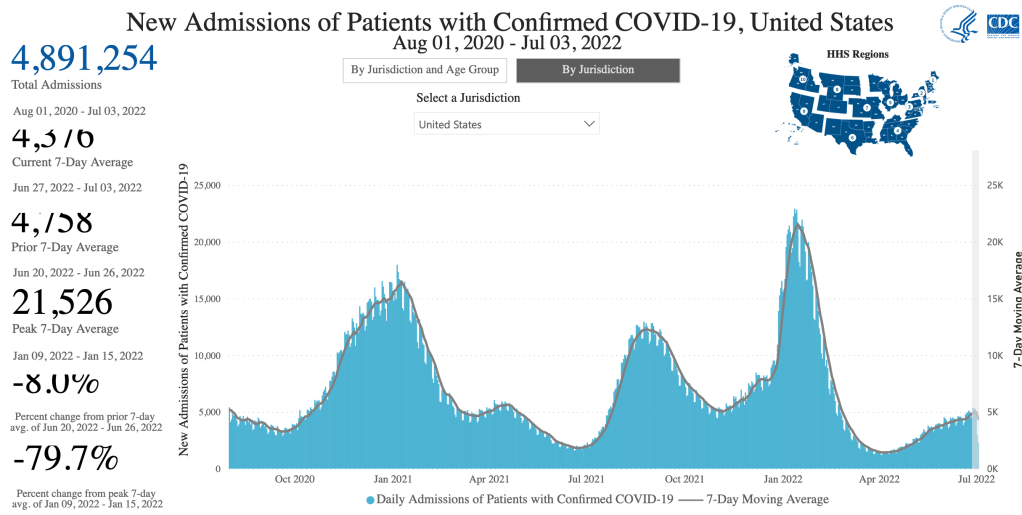
Some scientists now argue that since so many who are newly infected test themselves with over the counter tests, hospitalization is really the new measure of how much COVID is in the population. In the US, BA.5 has caused hospital admissions to go from about 4000 to about 6000 per day.
BA.5 is more dangerous than previous Omicron versions because it replicates down deep in the lungs like the original Wuhan strain, Alpha, Beta, and Delta strains. Most Omicron strains were less dangerous because they replicate in the trachea, thus can’t cause pneumonia. BA.5 is now 80% of new infections in the US.
John Campbell has an interesting new video out about BA.5. He argues that while BA.5 reinfect those with previous infections, even Omicron, natural immunity does give substantial protection. Dr. Campbell is from the UK, so much of his data comes from the National Health Service, which as been doing a better job at publishing data than the CDC.
Campbell discussed a paper from Altarawneh et al that claims that only 15% of Britons have no previous infections. 55% of new BA.5 cases come from this 15%. That means that 45% of new BA.5 cases come form the other 85% of people who have no previous infections.
After doing all the math, the authors suggest that infection with a pre-Omicron variant is 28% effective at preventing infection with BA.5, and infection with a previous Omicron version was 79.7% effective against reinfection with BA.5. All this to say, if you’ve had COVID before, you are less likely to get BA.5, and will likely have less symptoms as well.
Adenovirus is a very, very common virus in humans. It’s so common in fact, that most of us catch when we are very young, and have no symptoms, which is why we don’t hear about it much. Some adenovirus infections can look like a common cold. Adenovirus does not cause hepatitis.
However, doctors recently discovered that all of the children tested were positive for an unusual virus called Adeno-associated virus-2. This weird virus can only replicate in a human that is already infected with an adenovirus. So this is an unusual case in which 2 simultaneous infections are required to cause disease. AAV2 appears to be the actual cause of hepatitis in children.
At this point, researchers believe that the lack of exposure to common pathogens during the lockdowns has lead to the result that many children do not have immunity to common viruses that they usually do. AAV2 hepatitis does not happen in adults because they already have immunity to Adenoviruses.
So what should you do if you have small children? Well at first, in my opinion, allowing a normal social schedule is likely a good idea at this point. Death rates from COVID are still low and have not really increased due to BA.5, so the risk to others is likely low. You may want to limit their contact those who are at high risk for COVID.
Also, if your child experiences any of the following, especially in combination, seek medical attention immediately, at least a phone call to your doctor:
Nausea Abdominal pain Vomiting Diarrhea Jaundice (yellowing of the skin)
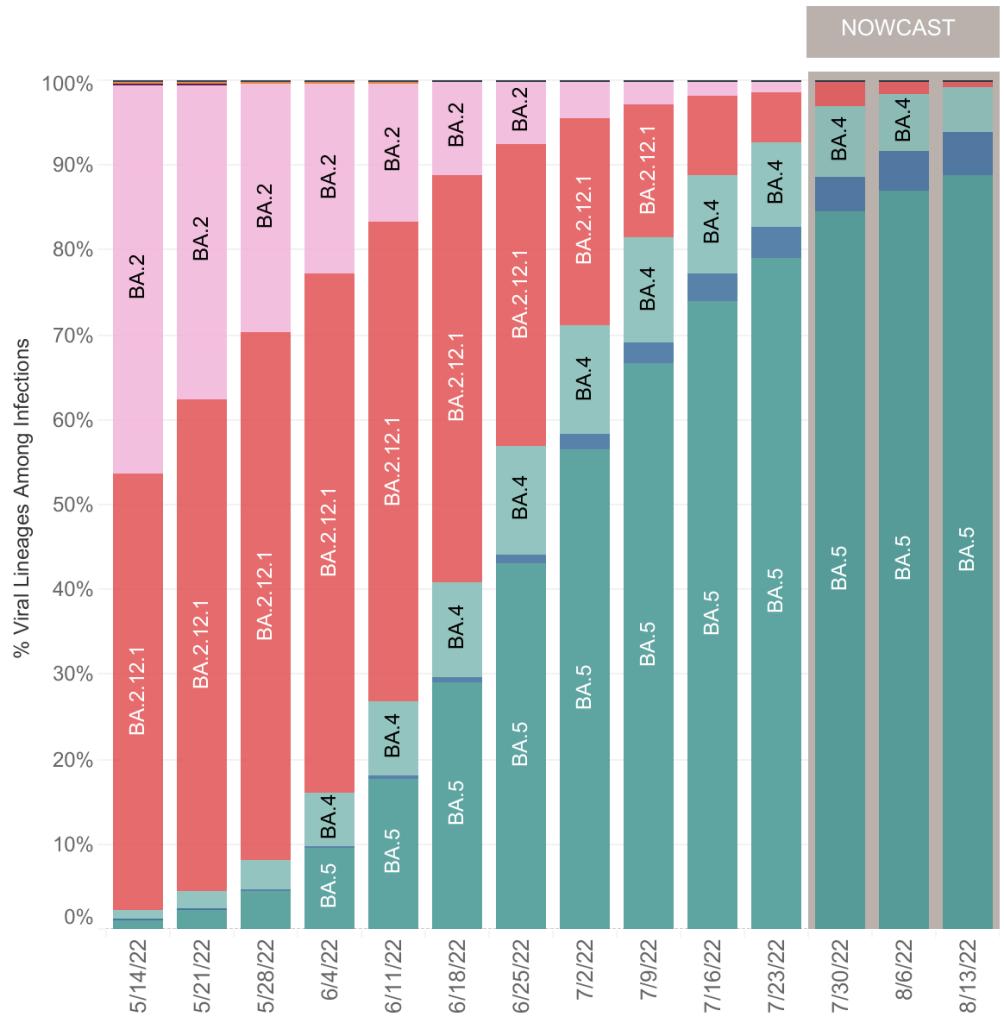
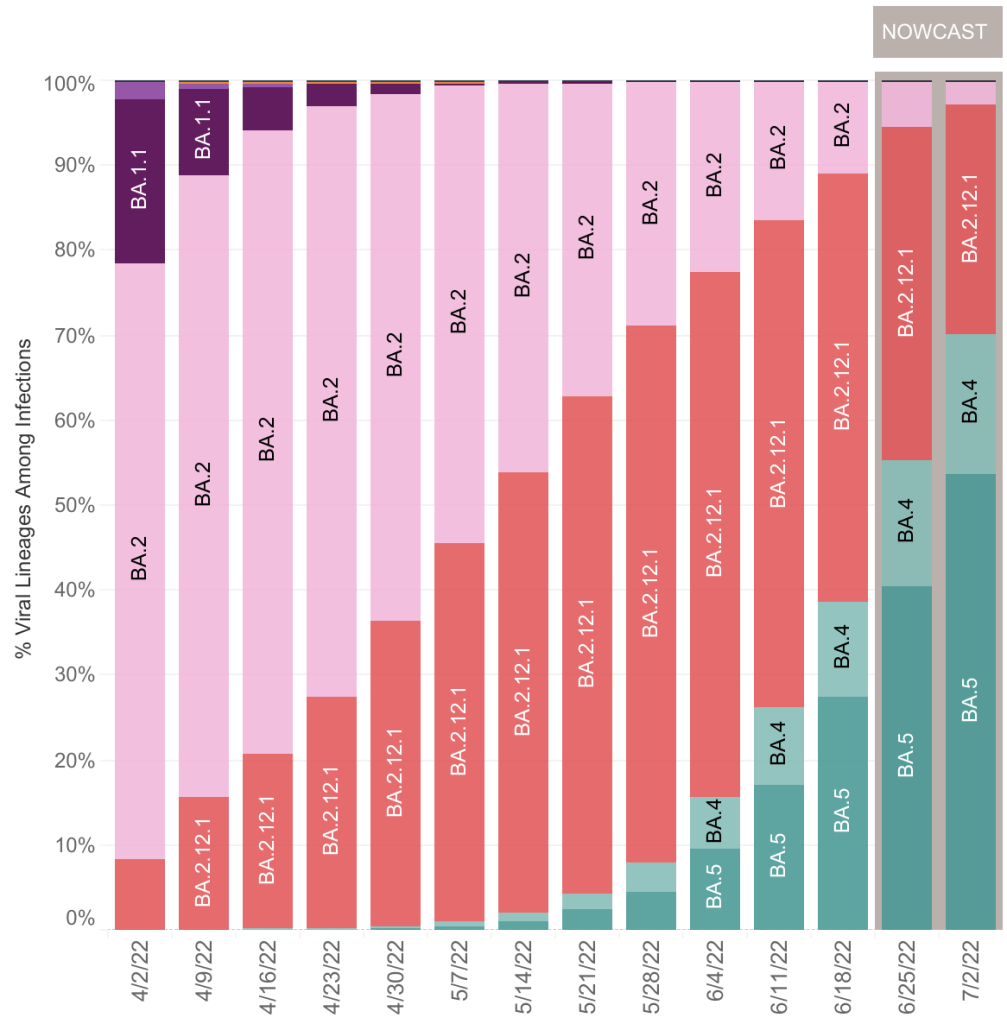
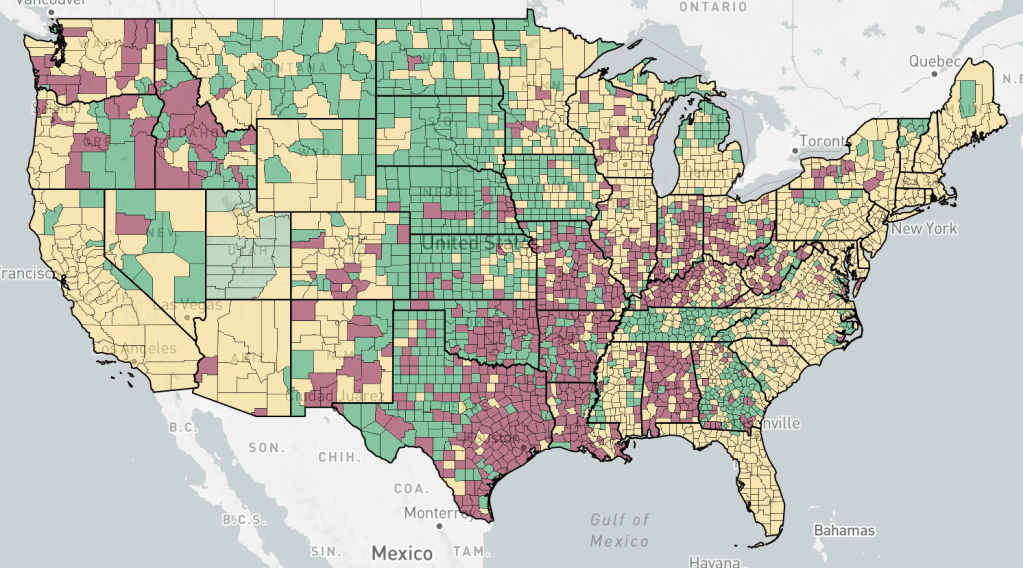
This is a case update. I’ll also discuss important new data in regards to BA.4 and BA.5 variants which you may want to take into account as you move around in our “post-COVID” world. You should especially read this if you’re one of the few who have never had COVID. I’ll also suggest a range of strategies that you may employ to keep yourself safe.
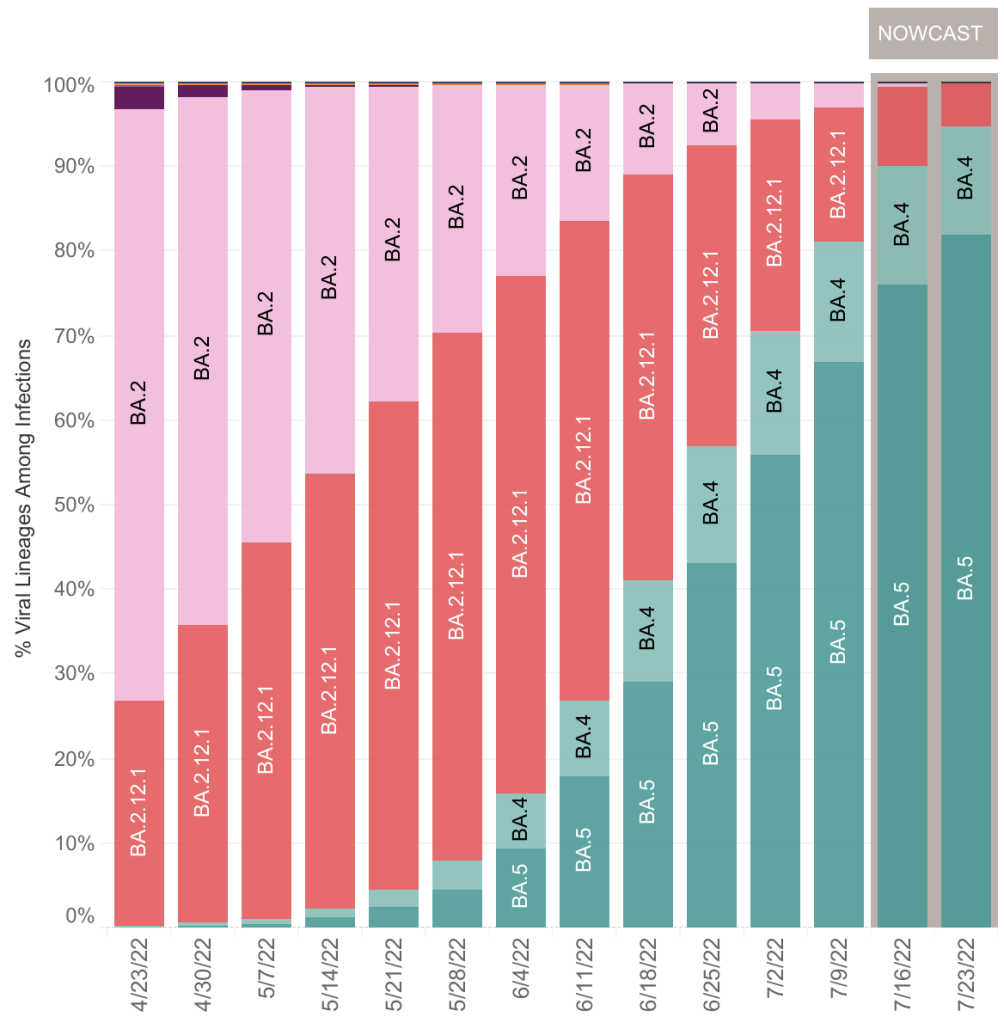
The update is actually not much different in the US from last week. Cases are medium-high but flat right now, and we have happily not yet seen increased deaths due to Omicron BA.2.12.1, BA.4, and BA.5 variants.
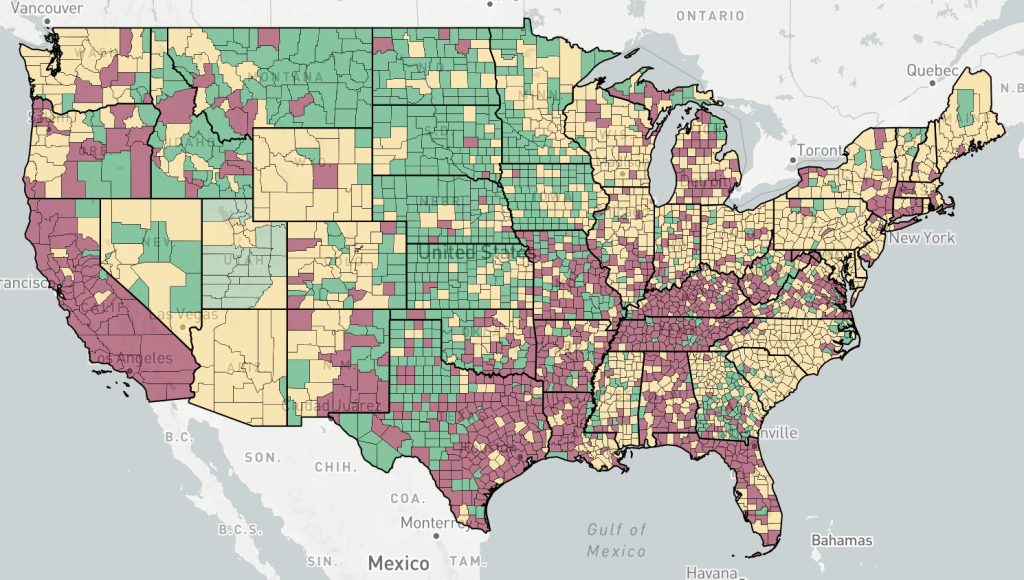
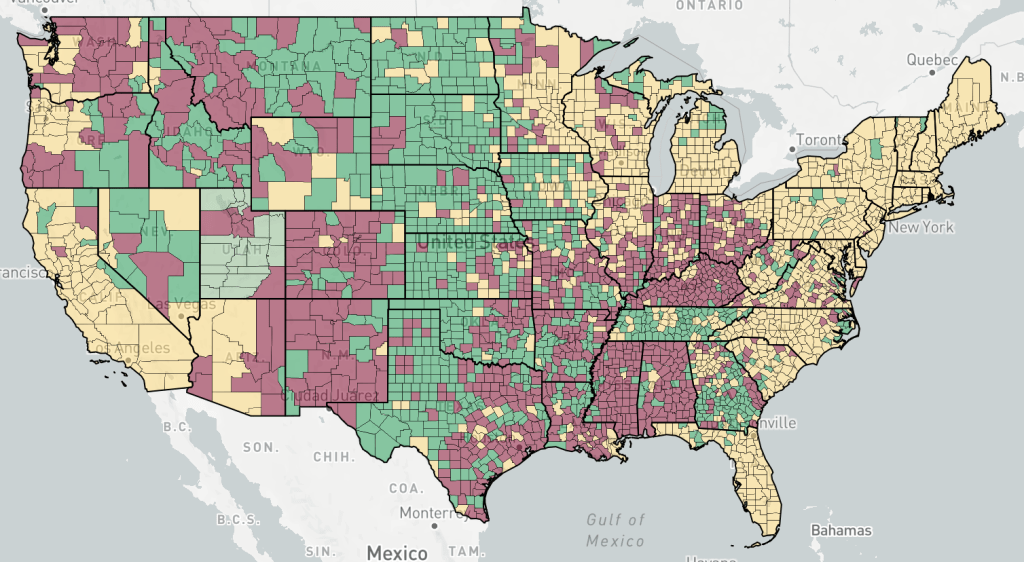
Graph is by me, from data collected from Johns Hopkins University COVID site. Graph is presented in a logarithmic format to emphasize small numbers. Note that each number on the left is 10x higher than the one below it.Graph is by me, from data collected from Johns Hopkins University COVID site. Graph is presented in a logarithmic format to emphasize small numbers. Note that each number on the left is 10x higher than the one below it.Endcoronavirus County Level Map, July 6th, 2022Graph is by me, from data collected from Johns Hopkins University COVID site. Graph is presented in a logarithmic format to emphasize small numbers. Note that each number on the left is 10x higher than the one below it.Graph is by me, from data collected from Johns Hopkins University COVID site. Graph is presented in a linear format.Graph is by me, from data collected from San Diego County Public Health. Graph is presented in a logarithmic format to emphasize small numbers. San Diego County now only releases information Monday and Thursday each week. Data points shown are extrapolated using this information.Graph is by me, from data collected from San Diego County Public Health. Graph is presented in a linear format. San Diego County now only releases information Monday and Thursday each week. Data points shown are extrapolated using this information.Graph is by me, from data collected from Johns Hopkins University COVID site. Graph is presented in a linear format.
BA.4 and BA.5 now predominate in the US, being 17% and 54% of cases respectively. Together, they are 70% of new cases. Hospitalizations are up slightly, but not nearly so high as in January, at the height of the Omicron wave.
Keep in mind that many and perhaps most people who have COVID right now are not getting tested by a health care provider, and are not being treated, so they are not a “case” and do not appear in current statistics. While it’s great news that we haven’t yet seen increased deaths in the US, there is sobering news which may cause a change in this in the next few weeks.
BA.5 reinfecting Omicron patients: A few weeks ago, an urgent care doctor friend of mine said that he had seen some patients who have had Omicron twice. Just this week, some friends of mine who had Omicron in January, just like me, came down with it again. They have COVID right now. Like me, they were pretty miserable in January for a full 2 weeks. Happily, their symptoms are moderate now, like a bad cold, just for 2 or 3 days.
Just yesterday, John Campbell released a video regarding BA.4 and BA.5. While he has a pretty bland delivery and focuses on the UK, he’s honest, balanced, and one of the only pundits still covering COVID in any detail.
Dr. Campbell’s newest video has some sobering information about BA.4 and BA.5 variants. As you can see from the data above, BA.5 is more infectious than BA.2 and BA.4, and will probably become dominant in the US in the next few weeks.
While still being called an Omicron variant, I wouldn’t be surprised if BA.5 gets it’s own Greek letter. Maybe Pi or Rho.
Unfortunately, Dr. Campbell claims that BA.5 is different enough from earlier Omicrons that they do not provide robust protection against BA.5 infection. He says Omicron is “poorly immunogenic”, but later clarifies in the video that this is likely because SARS-2 variants are changing very rapidly right now. The current COVID vaccines are having little impact, and the virus is changing so rapidly that updated vaccines are not practical to produce, meaning that the age of COVID vaccines is really already over.
For some good news, reinfections are usually milder than previous cases. So if you’ve already had COVID, BA.5 is likely nothing to be worried about.
Portugal had a lot of BA.4 and BA.5 in May and June, and they experienced more hospitalizations and deaths. Some worry that BA.5 may produce more severe cases in “naive” people, those with neither natural nor vaccine mediated immunity. Drs. Kei Sato and Stephen Griffin claim that BA.5 is growing deep in the lungs, like pre-Omicron versions, which makes it more likely to produce pneumonia. Most Omicron variants grow primarily in the trachea, which is why they are less likely to produce severe disease.
Last, Dr. Campbell argues from a letter by Hachmann et al, that prior infection plus vaccination offers better protection than either alone, but that BA.5 is still escaping neutralization. In my personal view, vaccination carries risks of it’s own, so if you are still not vaccinated, I would suggest taking increased precautions rather than vaccination at this point.
Cases in the UK are rising quickly right now, and often is a few weeks ahead of the US in any recent COVID trend. If data from Portugal and the UK hold true in the US, we may expect increasing cases in the US and perhaps more deaths as well.
Viruses have a tendency to become more infectious and less pathogenic over time. While this has been shown to be true many times in the last century, this is only a tendency and does not always hold true. While BA.5 is more infectious than previous versions, it’s tendency to grow in the lungs may make it more dangerous, so BA.5 is bucking the trend.
Strategies: Of course, it can be very hard to predict what will happen next. We also have a lot of different COVID experiences in the US in terms of whether someone has had COVID, what variant they had, whether they were vaccinated, etc. So any suggestions I make may not pertain to you.
Since I had COVID in January, I’ve been behaving in public as if I’m totally protected against a new infection. This may have been warranted, since I haven’t been infected again. I’ve even visited people with COVID at their house, treating it as an opportunity for a free booster. But this new information gives me pause. I may be more vulnerable to BA.5 than I had hoped.
On the other hand, even BA.5 is mild in those with previous infections, so I will likely be OK if I get BA.5. I am still not vaccinated and don’t intend to be. So going forward, I am going to continue to behave as normal, without masking in public at this point.
My main reason for being so careful before I got infected was the Antibody Dependent Enhancement (ADE) issue. Now that I’ve been infected, it’s not useful for me to continue with my previous caution. In fact, the “free booster” method may now help me with future versions more than avoiding infection would.
If you have never had COVID, you may choose to take increased precautions to prevent infection. Wear an N95, KN95, or KF94 mask when indoors in public. Don’t wear a cloth or blue surgical mask. These masks will not protect you from BA.5. Vaccination alone is not likely to be of much protection from BA.5.
If you do end up being infected with BA.5, regardless of the severity of your symptoms, stay home until you’re COVID negative to protect those around you who may be vulnerable.
Will COVID be endemic? A client of mine was kind enough to recommend my posts to his board, saying that my COVID predictions always come true! I would love this to be that case, but I can’t claim that kind of record. I have certainly been wrong during the pandemic. In particular, I’ve said that Omicron will end the pandemic, and that it will won’t likely have a new dangerous variant. BA.5 may end up proving me wrong on both counts. The lightning speed that new variants are developing also challenges my previous statements. I can’t claim to always be right, but I will tell you as soon as possible if I’ve been wrong.
So will COVID last forever? In spite of BA.5, I still say no. While it has exceptions, the tendency for new viruses to be less pathogenic still holds true. I still expect new variants to generally be less dangerous than older ones. In fact, BA.5 will likely still have less impact than previous versions simply because so may people have previous infections.
This is a brief COVID update. Cases have been flat in the US, California, and San Diego County, neither rising or falling. This may be partially because of the introduction of 2 new variants, BA.4 and BA.5. These new variants are both of the Omicron vintage. The good news is that deaths have not risen for many weeks even after cases rose due to the BA.2 variants.
Graph is by me, from data collected from Johns Hopkins University COVID site. Graph is presented in a logarithmic format to emphasize small numbers. Note that each number on the left is 10x higher than the one below it.Graph is by me, from data collected from Johns Hopkins University COVID site. Graph is presented in a logarithmic format to emphasize small numbers. Note that each number on the left is 10x higher than the one below it.Endcoronavirus County Level Map, June 28th, 2022Hospitalizations, from the CDC website.Graph is by me, from data collected from Johns Hopkins University COVID site. Graph is presented in a logarithmic format to emphasize small numbers. Note that each number on the left is 10x higher than the one below it.Graph is by me, from data collected from Johns Hopkins University COVID site. Graph is presented in a linear format.Graph is by me, from data collected from San Diego County Public Health. Graph is presented in a logarithmic format to emphasize small numbers. San Diego County now only releases information Monday and Thursday each week. Data points shown are extrapolated using this information.Graph is by me, from data collected from San Diego County Public Health. Graph is presented in a linear format. San Diego County now only releases information Monday and Thursday each week. Data points shown are extrapolated using this information.Graph is by me, from data collected from Johns Hopkins University COVID site. Graph is presented in a linear format.
My guess is that BA.4 and BA.5 will continue to drive new cases for a few more weeks before we start seeing cases come down. It appears that the fatality rate for these new variants is also very low when compared to other COVID variants.
The contribution BA.4 and BA.5 variants in the US is growing, as they new represent approximately 50% of the total SARS-2 viruses in the country.
This is a COVID update, and I’ll discuss the emergence of BA.4 and BA.5 in the US.
New daily cases have peaked in the US, California, and San Diego. We have yet to see a sustained increase in deaths due to the new BA.2 variant in any of these regions. While new cases have not really started to decrease, the numbers have definitely peaked.
Graph is by me, from data collected from Johns Hopkins University COVID site. Graph is presented in a logarithmic format to emphasize small numbers. Note that each number on the left is 10x higher than the one below it.Graph is by me, from data collected from Johns Hopkins University COVID site. Graph is presented in a logarithmic format to emphasize small numbers. Note that each number on the left is 10x higher than the one below it.Endcoronavirus County Level Map, June 14th, 2022Graph is by me, from data collected from Johns Hopkins University COVID site. Graph is presented in a logarithmic format to emphasize small numbers. Note that each number on the left is 10x higher than the one below it.Graph is by me, from data collected from Johns Hopkins University COVID site. Graph is presented in a linear format.Graph is by me, from data collected from San Diego County Public Health. Graph is presented in a logarithmic format to emphasize small numbers. San Diego County now only releases information Monday and Thursday each week. Data points shown are extrapolated using this information.Graph is by me, from data collected from San Diego County Public Health. Graph is presented in a linear format. San Diego County now only releases information Monday and Thursday each week. Data points shown are extrapolated using this information.Graph is by me, from data collected from Johns Hopkins University COVID site. Graph is presented in a linear format.
BA.4 and BA.5 in the US: I commented on May 24th about the new BA.4 and BA.5 variants. At that time, the CDC was not reporting these variants in the US. The new CDC bar graph of variants now shows that approximately 20% of the SARS-2 virus in the US now from BA.4 and BA.5.
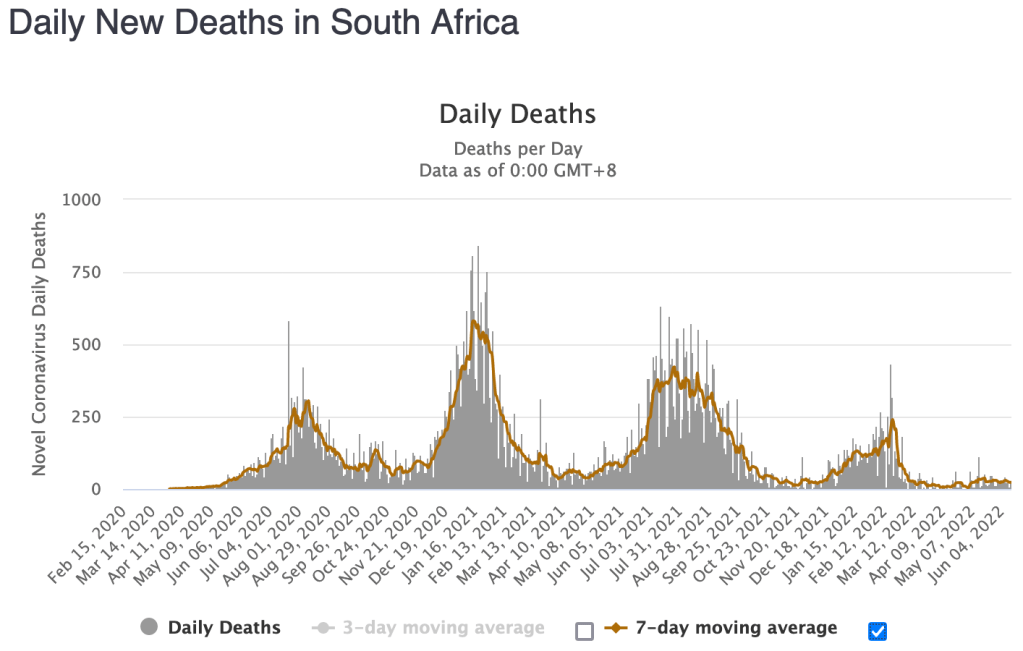
Will we have another peak? Maybe. These variants may have arisen in South Africa, and the BA.4 and BA.5 peak has already come and gone there. The peak was much smaller than the original Omicron peak, and generated even fewer deaths. South Africa did not experience a BA.2 wave of Omicron cases.
From Worldometer. The wave starting in December 2021 is the B.1 Omicron wave, the wave starting in April 2022 is the BA.4/BA.5 wave.From Worldometer. The wave starting in December 2021 is the B.1 Omicron wave, the wave starting in April 2022 is the BA.4/BA.5 wave.
These new variants appear to follow the tendency for new viruses to be more infectious and less pathogenic (disease causing) than earlier ones. So we may see a shoulder to our current peak, but we won’t likely see significantly more deaths. Obviously, I’m using “significantly” in a cold, statistical sense here.
A negative trait of the BA.4 and BA.5 are that they are even less responsive to vaccination than previous Omicron variants. So vaccination is not likely to help much against infection. Reinfection after previous infections with Delta and earlier versions appears to be more likely.
I haven’t seen much in our popular media about these new variants. The only commentator who has discussed these new variants significantly is John Campbell.
If SARS-2 continues to become more infectious and less pathogenic, it may become part of the background, like a cold. I still don’t think it will last forever. I think it will eventually burn itself out.
A note on BA.2: The BA.2 variant is significantly different from the BA.1 variants. Some scientists are now saying that the BA.2 variants should not have been considered an Omicron variant, and should have gotten their own Greek letter designation. The next letter is Pi. Maybe they would have skipped this one to avoid confusion at Marie Calendars!