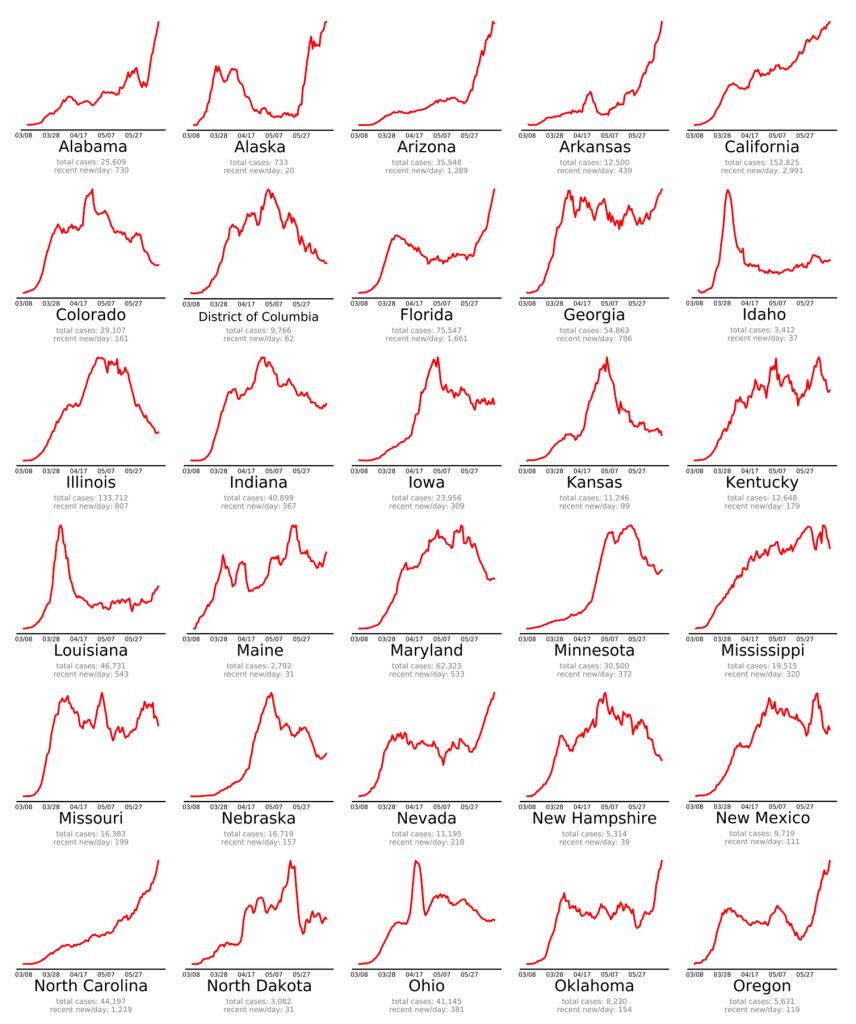
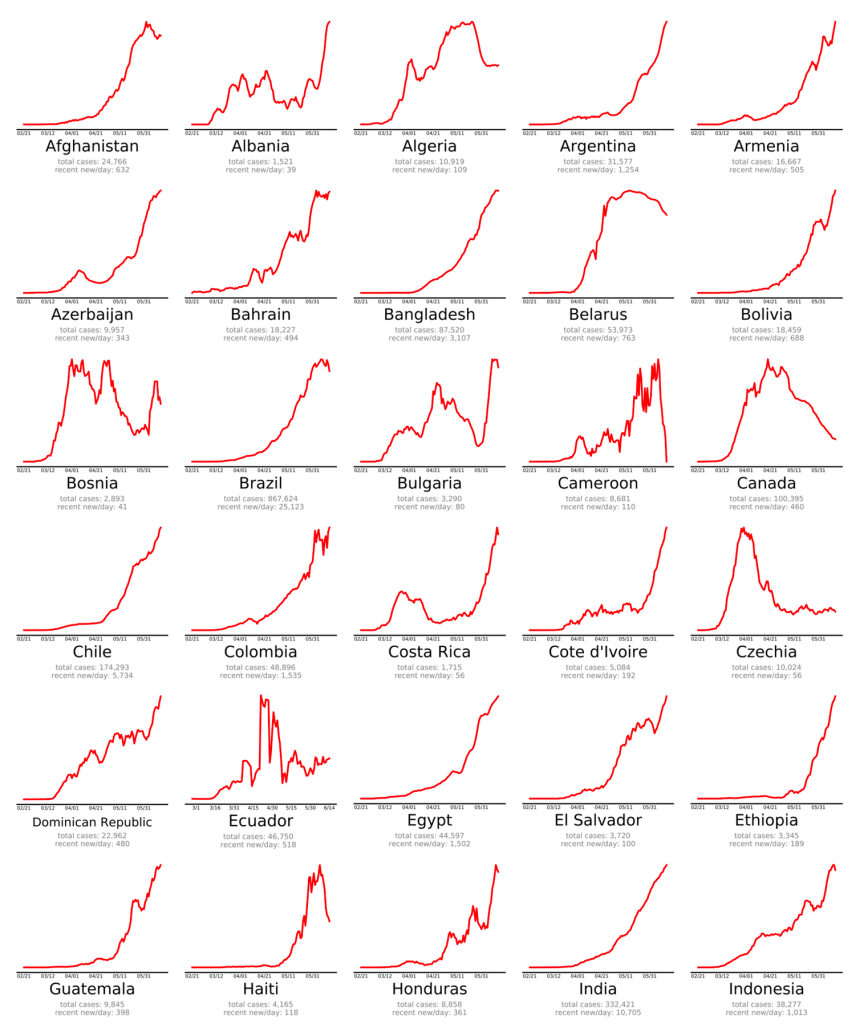
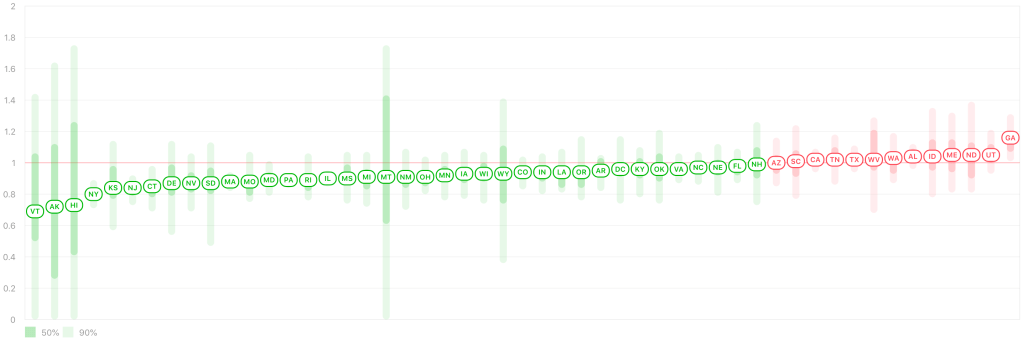
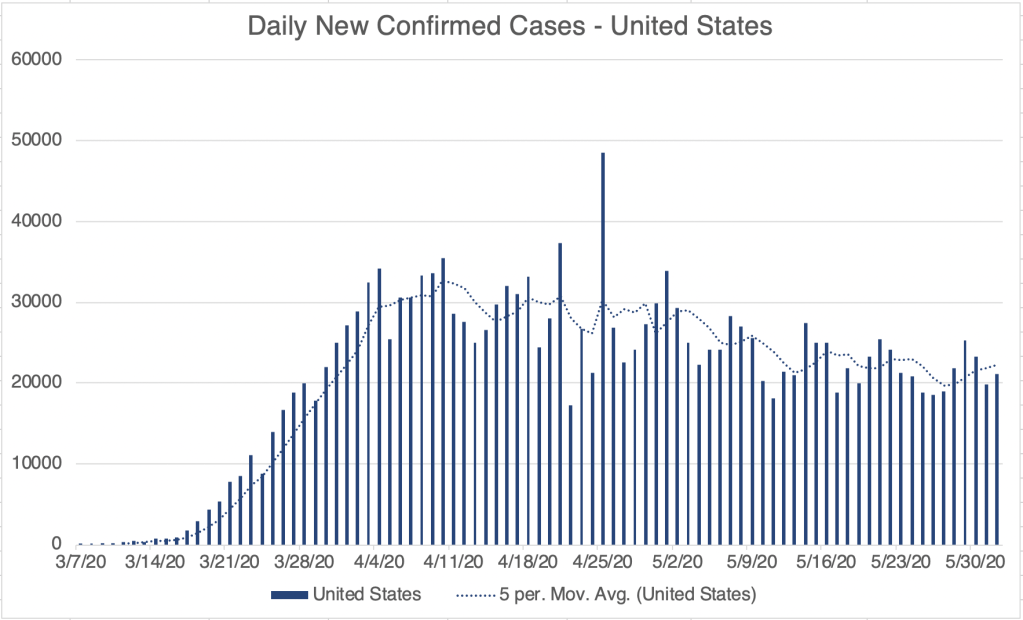
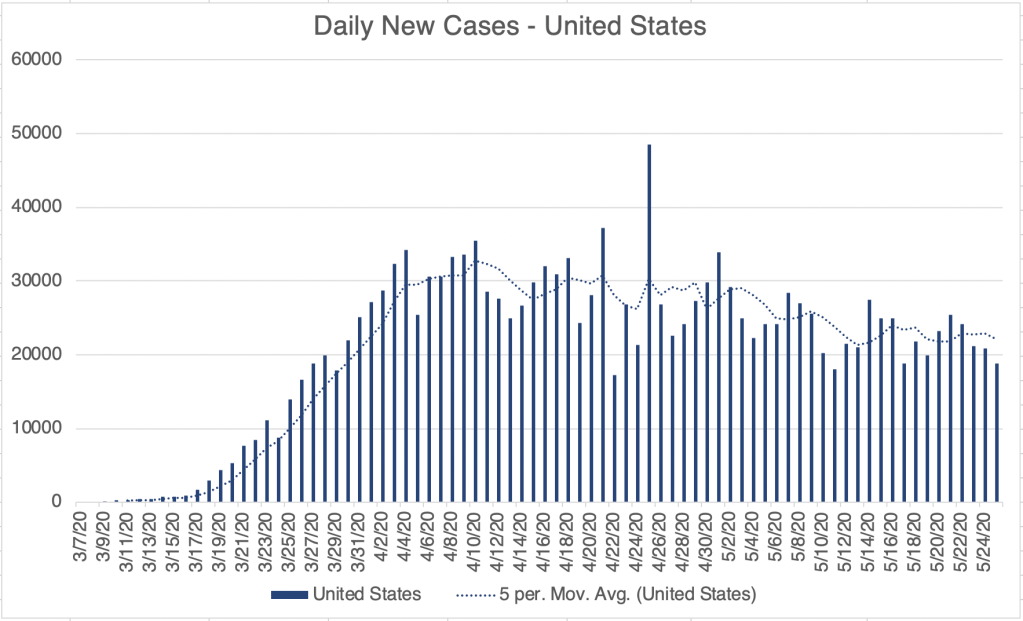
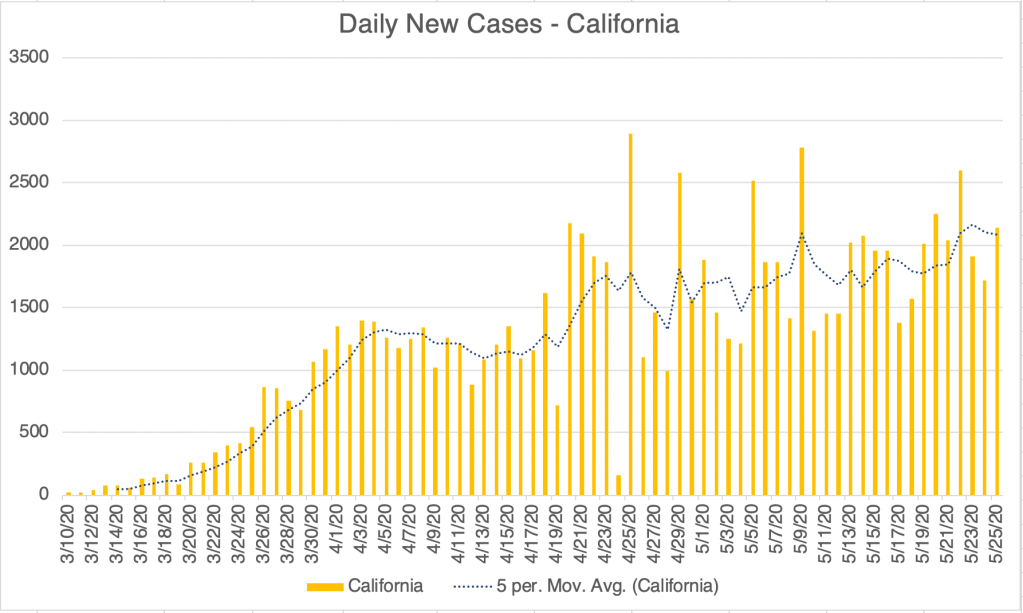
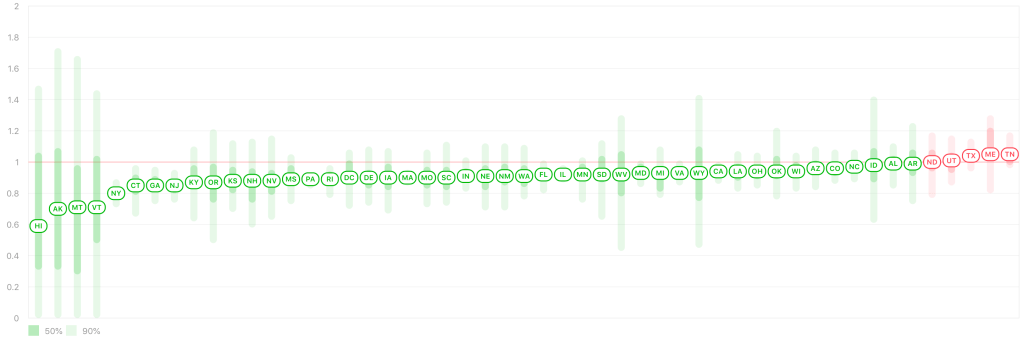
This is a case update. New confirmed cases are starting to trend upward for the US again for the first time since about April 9. In 19 US states, the Rt number is higher than 1.0, suggesting that the virus is spreading in these states. On endcoronavirus.org, you can clearly see recent spikes of new cases in some states, and in many countries.
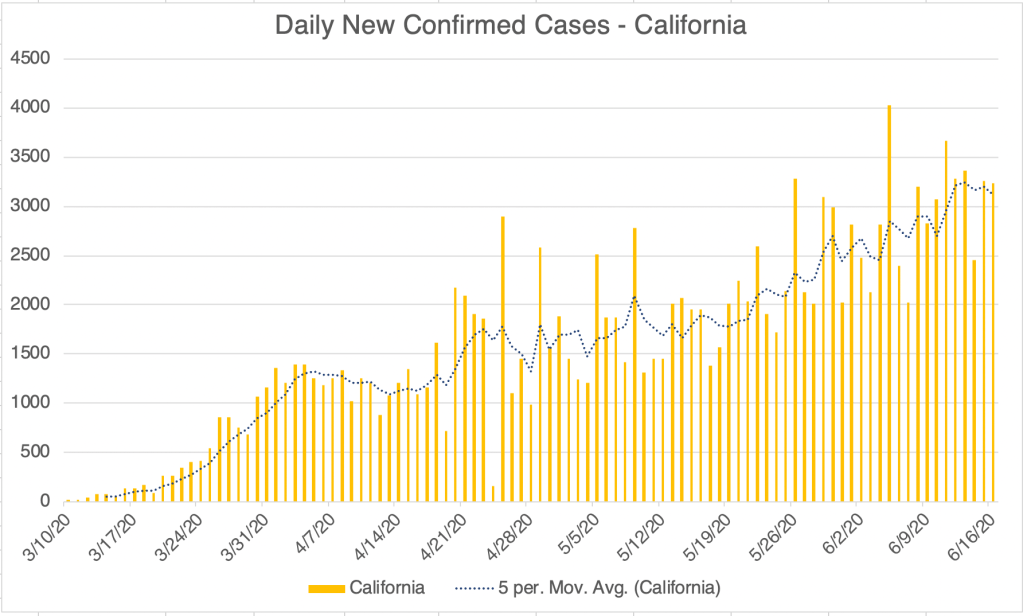
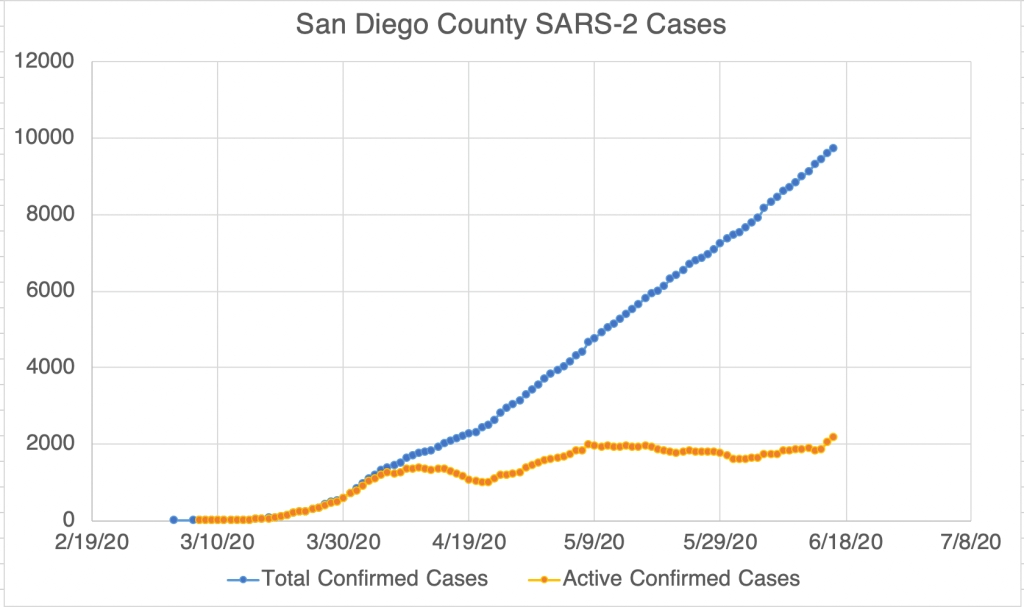
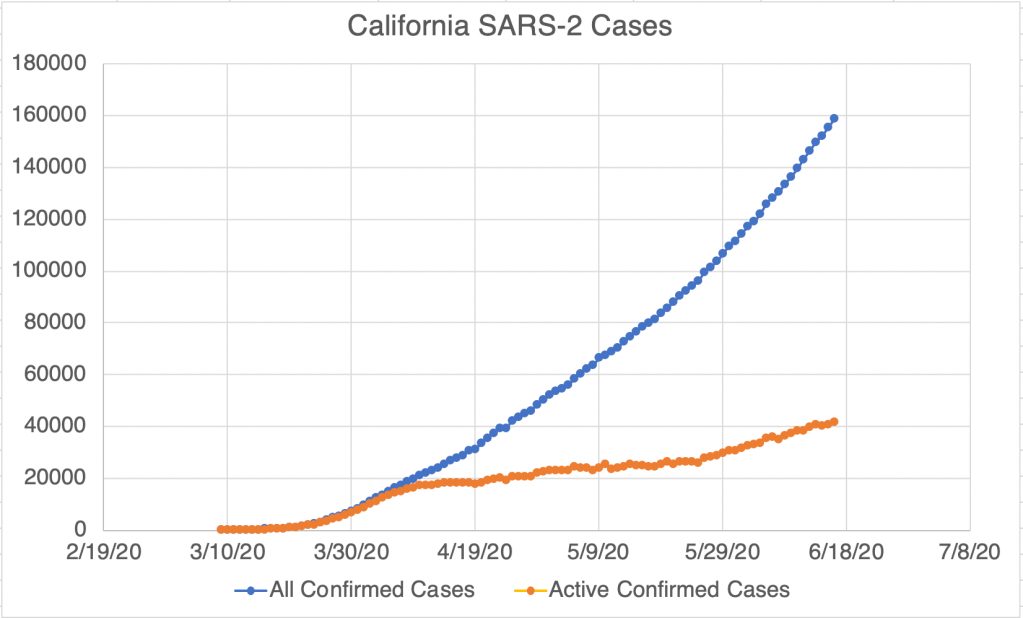
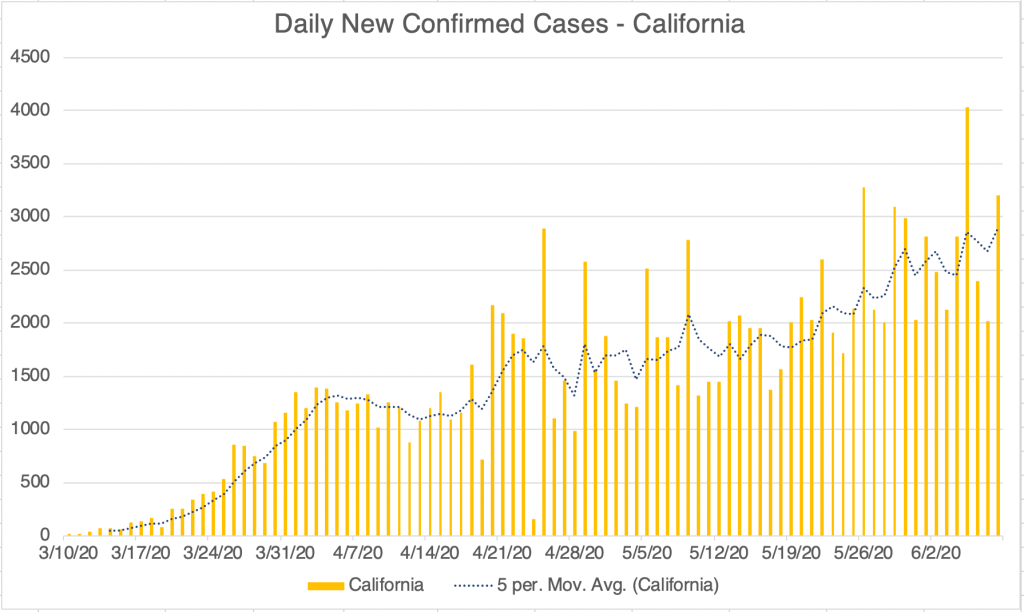
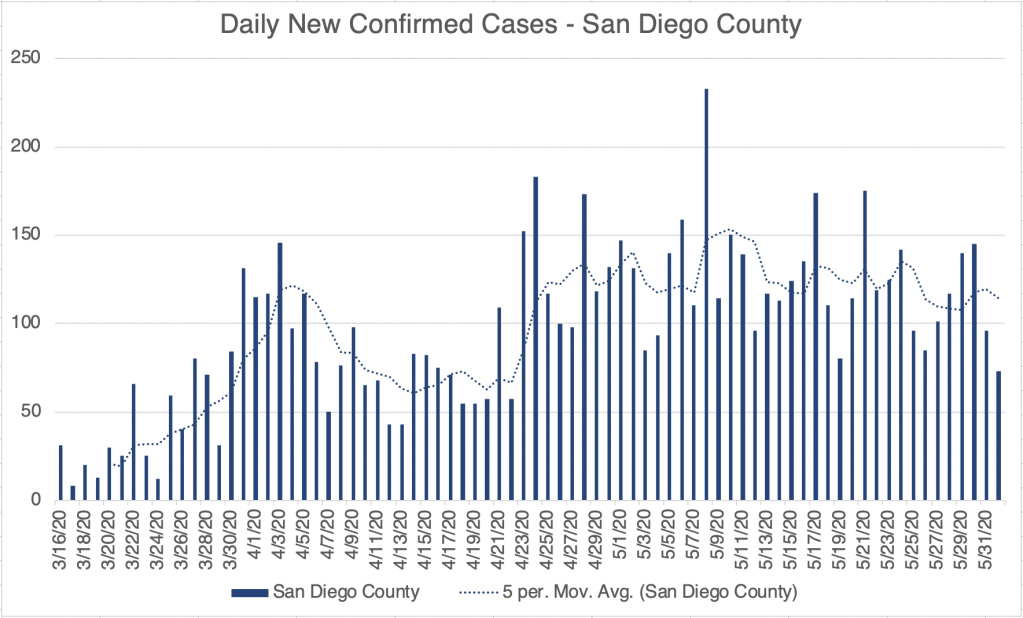
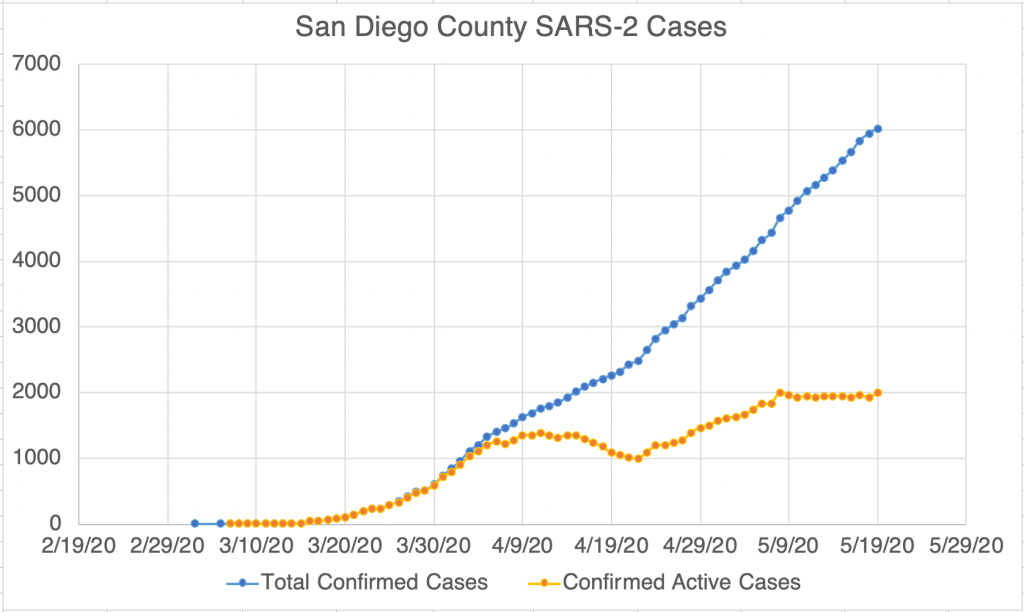
In California, the number daily new cases continues to accelerate. San Diego has started to go up too. San Diego County has started to publish the number of recovered patients. My graph of cases in SD County now includes active cases, taking recovered people into account. Some of these points of data on my graph are given by SD County, the others are calculated by me based on the data points. Looking carefully at the SD County data, the number of recovered people is approximately the number of total cases from 17 days previous. The suggestion is that it takes approximately 17 days to recover after being confirmed as a COVID case, so I’ve made a similar calculation for California. Just to be clear, in my graph of active cases in California, the data points are based on assumptions about recovery time, not actual data.
For San Diego, active cases have been hovering around 2,000 for several weeks, without much change, but for an increase in the last few days. For California, we’ve seen a steady trend upward in active cases from 20,000 in early April, to 40,000 cases today. There are of course lots of potential reasons for these increases, from gradual re-opening to the protests and riots stemming from the George Floyd incident. I was once optimistic that the first wave of cases would be over this Summer, but new trends have called this into question. I’m now feeling totally unable to predict how things will go.
I heard a radio commentator talking about a recent study that I haven’t been able to find. The study said that while Social Distancing account for maybe a 50% drop in new cases, the lockdown accounted for only a 5% additional drop. Given the economic and social cost of the lockdown, the study suggested they were not on the whole worth the cost. If you’ve seen the actual study, please post it in the comments!
So please continue to social distance and wear your masks in public! But it’s time to figure out how we can get the economy running again! We have big problems to solve, time to get to work!
Here’s the weekly update on the virus. As I predicted in my June 2nd post, we’ve started to see an increase in cases, at least for areas that I closely monitor. For the United States as a whole, the increase has been subtle, really just a flattening of a steady downward trend. For California and especially San Diego County, there has been a pronounced uptick in cases during the last week. The City of San Diego had some protests last weekend, but not nearly as much as in other cities like Minneapolis, NYC and LA. If the pattern for San Diego holds for other cities, they will experience more severe increases in cases. Oddly, many in the media strongly discouraged protests in favor of re-opening, but are seemingly promoting protests about police brutality without regard to precautions like mask wearing. Even the WHO is encouraging mass protests. Of course there are good reasons to attend a peaceful protest. If you go to a protest, please wear a mask. Of course, I have to discourage you from attending a riot.
I do have to point out that there are many factors that contribute to these increases, such as the ongoing re-opening, and no single factor can be blamed.
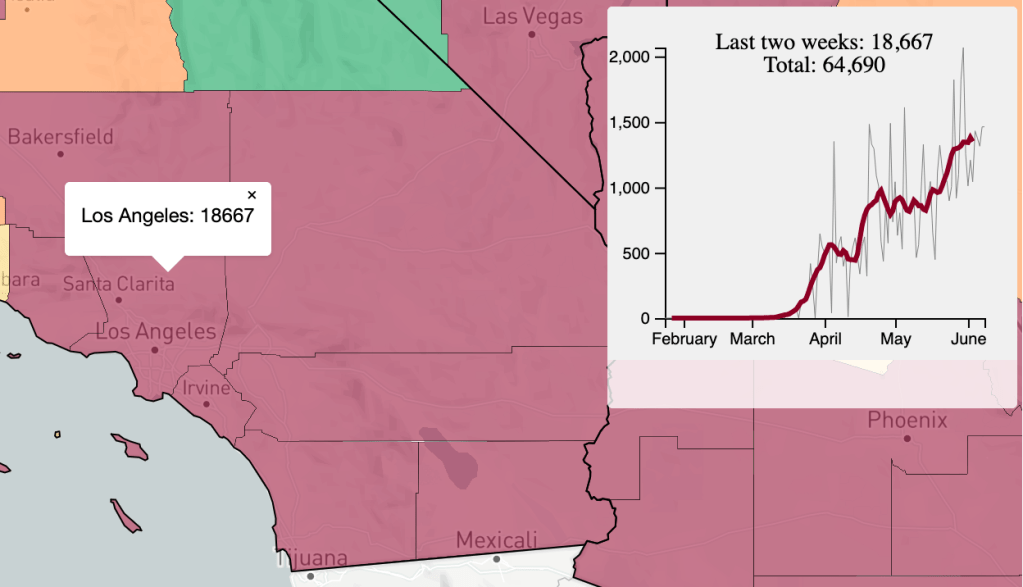
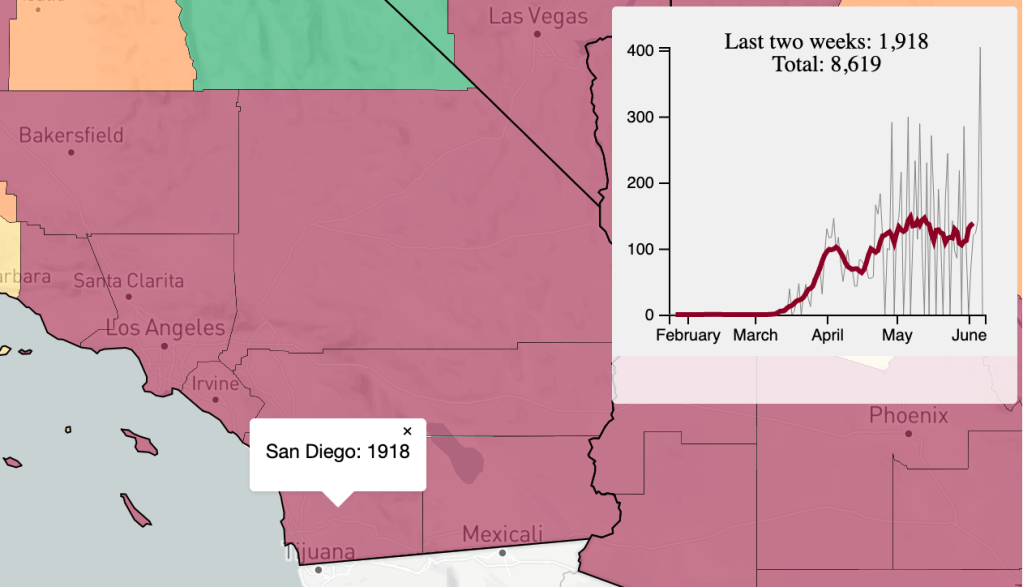
Endcoronavirus.org has introduced a new feature in the last week, a county level map showing the recent change in new cases. Clicking on a county will give you a plot of new cases for that county. High caseloads for urban areas is a well known pattern, but I’ve also noticed hot-spots of cases in certain rural areas. A new article in the Wall Street Journal may suggest a reason. Large families living in the same house may present an opportunity for rapid spread should someone be infected who lives there. As we discussed on May 27th, the virus spreads much more quickly in indoor venues than it does outside. This suggests that if you have a large family, members will need to be extra cautious to not bring virus in from the outside.
My friend who works for San Diego County Health, Brit Colanter, just posted that all San Diego County residents are encouraged to get tested for COVID-19. Check with your health care provider first to see if they will give you a free test. If not, check the below website, or call 2-1-1 for an appointment at a County Site. State run testing sites are located in Escondido, El Cajon, Chula Vista, San Ysidro and Southeastern San Diego. Check the website for a phone number or link to get an appointment at a state site.
These are likely the Abbott, ID Now rapid COVID test.
Getting a test gives you peace of mind, but also helps scientists understand the real rate of infection in the County!
Well, this has been a very discouraging weekend for me and I’m sure for many of you. The unjust killing of George Floyd as well as the riots that were fomented by far left elements have taken the spot light from the Coronavirus of course.
It has been a very rough week, and I’m afraid I don’t have an encouraging update for you. Nationally, the daily new cases continues to go down. However, according to Rt Live, 13 states currently have Rt values above 1.0, including California, meaning that the virus is now spreading again in those states. Daily new cases in California are continuing to increase in California, and in fact the increase has been accelerated since restaurants and other businesses were reopened on the 21st.
Rt values for various US States and territories. 13 states currently have Rt values above 1.0, meaning that virus is now increasing in those states.
San Diego is nearly flat in new case numbers, but zooming in on recent new confirmed case numbers shows that the County is actually improving, even after re-opening, so we can be glad for that at least, if you live in SD County.
San Diego County new confirmed cases since April 23, 2020. Dotted trendline highlights a trend of decreasing numbers.
For those of you in Montana, there was a small cluster of new cases this week which made the Rt value go up above 1.0 for a brief time. This is because the Rt value reflects a change in numbers, and since the numbers were so low in Montana, any cluster will make this number rise. After a few days, the Rt value for Montana is back below 1, and Montana continues to do well. But this illustrates how important it is to be diligent, even in a state that is generally doing well.
Rioting has of course broken out in many cities in the US. Starting as peaceful protests, many were hijacked by far left elements that wanted to cause wide-spread chaos. Among other damage, rioters and looters were often in close contact without masks on. And yes, I know is sounds a little comical to be worried about that when watching scenes of small businesses being destroyed. Look for Coronavirus case numbers to rise sharply later this week. I’ll keep you posted.
Yesterday right after I posted, Mark Rasmussen sent me an article that ran in Science Magazine, one of the 2 most highly regarded science journals in the world. It’s a news article, not a peer-reviewed journal article, but it attempts to pull together information from different sources, and I think clarifies the picture regarding SARS-2 viral spread. The take-away message of the article is that while the R0 appears to be between 2.5 and 3 (more on that later), it’s not true that the average individual will pass the virus on to 2 or 3 others. Rather, most infected people don’t pass the virus on to anyone at all, rather a few infected people are “super-spreaders”, infecting a large number of people at once. There are many documented cases of super-spreading, from choir practices, funerals, concerts, fitness classes, and meat packing plants. The commonality appears to be indoor locations with lots of people in a small space, with some of them shouting or singing. While the risk in outdoor venues isn’t zero, indoor venues account for 19 times the number of super-spreading events, according to a Japanese study.
According to the article, SARS-2 has a tendency to cluster in this way more than other respiratory diseases such as the flu or colds. This may be partially because of the “viral load” effect mentioned in the Erin Bromage article I posted on May 12th. In that article, it appears that the initial number of viruses an individual is exposed to partially determined if they will be infected, and how sick they will get. This also explains why so many medical workers in Italy got very sick or died in the early stages of the pandemic. Many medical procedures such as intubation create a bloom of floating virus from a sick patient, exposing unprotected workers to high viral loads.
The science article suggests that while the virus is still dangerous and outdoor venues are not completely without risk, it may be appropriate to relax restrictions on some outdoor activities. So here’s my informed but not expert advice on how to adapt to life with COVID:
Staying at home all the time may no longer be the best approach, although it was probably very helpful in the early stages of the pandemic. Going outside to get some fresh air and exercise is probably a good thing, although still not without risk.
When doing outdoor activities, it’s probably OK to not wear a mask, but maintain at least 6-10 ft from others you don’t live with. Locations with a gentle breeze will help move virus away from you!
At work or shopping, wear a mask when around others to reduce the viral load that you are wafting into air should you be infected without your knowledge. Any reduction in viral load will help.
If you suspect you may have been exposed, contact your physician and see if you can get a test.
If you have a yard, invite a few friends over for lunch or dinner at a safe distance. Since Summer is starting, an evening outdoor dinner will be a welcome break from the isolation. You may want to have your guests bring their own food and utensils. Don’t invite a large number of friends, and sorry to say, don’t invite those friends who can’t resist hugging everyone! Young children may require supervision to be safe.
Now that restaurants are open in California, I would personally only be comfortable with outdoor seating at the moment. If you’re comfortable, visit your favorite local restaurants to give them some business, sit outside, and leave your server a big tip if you’re able!
I am a church goer, and I want to see my peeps again, but singing in a congregation is still a high-risk activity. Churches will need to be creative to open up again safely. Consider lower density services without singing, and/or hold services outdoors.
Regarding the R0 value for SARS-2. I saw a CDC website last week that gave the R0 value as 2.5. After 10 minutes of looking, I couldn’t find this site again. The Sanche paper I’ve referenced before (High Contagiousness and Rapid Spread of Severe Acute Respiratory Syndrome Coronavirus 2, EID, July 2020), published in the official CDC journal, Emerging Infectious Disease, gave the R0 as 5.7. So the CDC itself seems confused about what the R0 number is. My guess is, it’s somewhere between 2.5 and 5.7. That was a joke. Obviously, this range is far too large to be useful, and 2.5 and 5.7 are very different as applied to an R0 number. 2.5 is a very infectious disease, 5.7 is a super-infectious disease.
I’ve mentioned this before, but I want to remind everyone. Herd immunity is only a goal when a vaccine is available. Seeking herd immunity when there is no vaccine is not a good idea, because it will put large numbers of people at risk. Additionally, I am generally very pro-vaccine, but because of the risks of side-effects with this particular virus, a vaccine may not be available for several years. We will need to adapt to this reality. My hope is that we will start seeing daily cases come down this Summer.
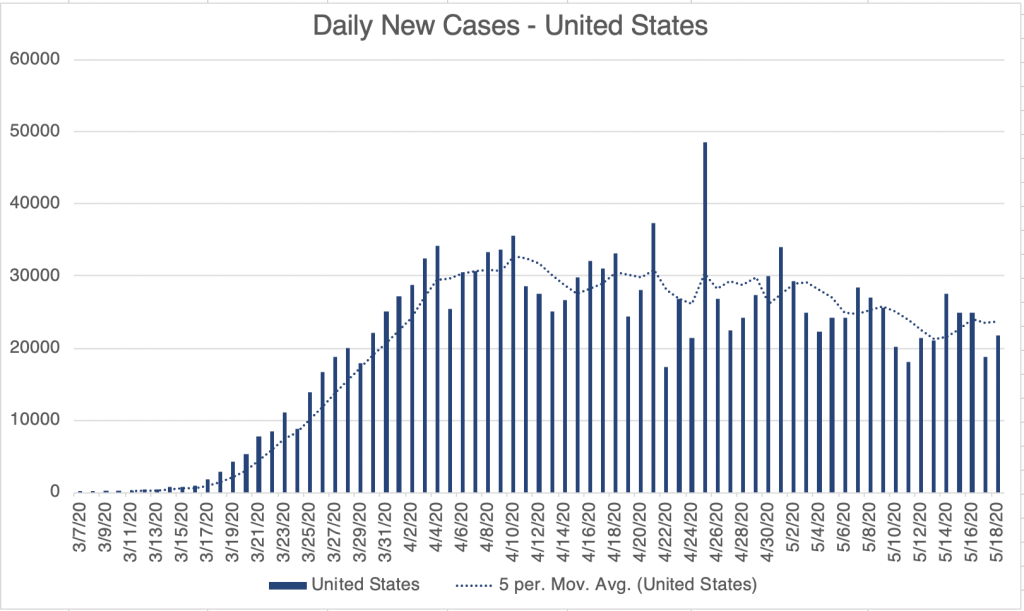
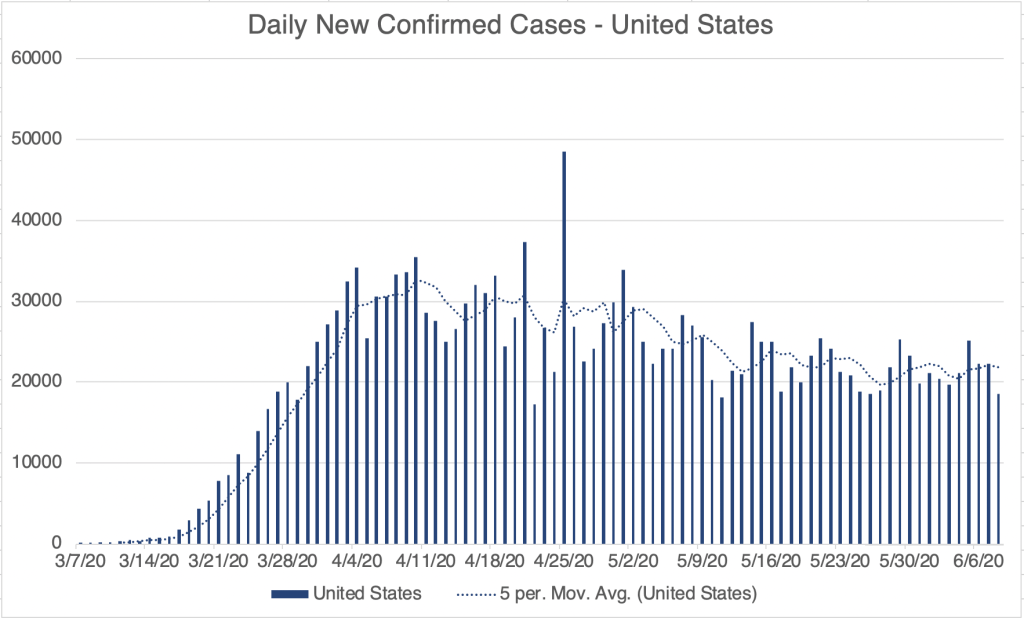
Today I have a weekly update on cases, followed by some speculation on what it means. As we’ve seen before, the United States has a slowly diminishing daily new case load for confirmed cases. Death rates for the US, perhaps a better measure than confirmed cases, are also slowly diminishing. Several sites seem to be accepting the data from Sutton et al (Universal Screening for SARS-CoV-2in Women Admitted for Delivery, NEJM, April 22, 2020) to estimate that actual cases is 8 times that of confirmed cases. California continues to have a slowly increasing caseload.
According to the John Hopkins University COVID site, LA County accounts for a full 48% of cases in California, with Sierra and Trinity Counties, in the East and North having just 1 case each. Cases are definitely centered in urban areas, mostly in Southern California. Daily death number in California appear to be perhaps flat. Interestingly, with all of these graphs, California daily deaths in particular, there is a clear weekend effect, with a weekly low in numbers on Sunday or Monday of each week. So when you look at the daily caseload for the US, with it’s jagged Sierra-like peaks, you’ll know it’s because health-care workers take the weekend off too, and reporting is being done during the week! San Diego’s numbers continue to be relatively flat.
Data is collected from San Diego County Public Health at approximately 9:30 pm nightly.
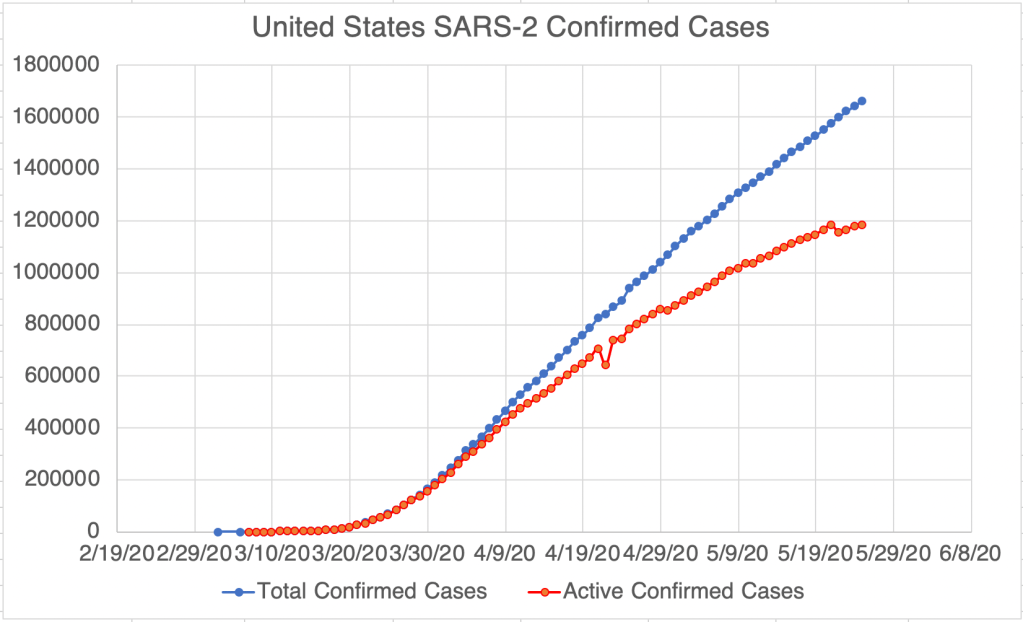
What we would like to see now is a lowering in the number of active cases. Unfortunately, this highlights a problem in all of this, how health departments define a “recovered” case. San Diego has just begun to report recovered cases. The reported numbers suggest that cases resolve in about 16 days after confirmation on average. For the US, reported recoveries suggest that patients recover in 50 days. California doesn’t report recoveries at all. Each entity defines a recovered case differently, so it will be difficult for us in the public to tell how many have recovered.
Data is collected from Johns Hopkins University at approximately 9:30 pm nightly. https://coronavirus.jhu.edu/map.html Reported recovered patients suggest recovery after 50 days after confirmation.Data is collected from San Diego Public Health at approximately 9:30 pm nightly. Active cases after 5/15 are based on data released by San Diego County. Points previous to 5/15 are calculated based on the assumption that recovery time after detection is 16 days. Reported recovered patients suggest recovery after 16 days after confirmation.
Reports from last week regarding the possible failure of lockdowns to bring numbers down are causing a lot of speculation on line as to the best way to improve. Many Western countries are struggling to reduce the number of new cases, and many countries are only now having their initial surge in cases (see my May 24th post).
In the US, several states are creeping back toward an R0 of 1.0 after re-opening. We definitely want to stay below 1.0, as this indicates a slowly vanishing caseload. Texas was doing very well for a long time, but the R0 there is above 1.0 for the first time in quite a while. Cases are predominantly in urban areas, Houston, Dallas, and Austin.
A lot of studies are being done on the best approach. Japan is of particular interest because after an initial very small peak, they had a much larger peak starting in late March. They didn’t have the massive testing of So. Korea, nor did they have a strict lockdown. But they got things back under control quickly, and they have a very low daily caseload now, despite the VERY high population density of cities like Tokyo. So far, people are speculating that they are doing well because it’s culturally acceptable there to wear masks on a regular basis, and others are just calling it a mystery. I’m sure researchers will be taking a close look at Japan.
All the best to you and your family!
Don’t fear, but be smart,
Erik
Sutton et al (Universal Screening for SARS-CoV-2in Women Admitted for Delivery, NEJM, April 22, 2020):
Today I’m going to discuss the JP Morgan study on transmission (among other things), how the Moral Matrix effects how people see the fight against the virus, and the boom stage in many Southern Hemisphere countries.
JP Morgan has produced a study suggesting among other things that lockdowns are ineffective in fighting Coronavirus (see also a summary from Daily Mail). The reasoning for this is primarily that transmission is most common in households if a member becomes infected.
Frankly, when I think about anti-coronavirus efforts, I have tended to lump lockdowns and social distancing together, especially since many use these terms interchangeably. Notably, the study separates these 2 concepts and suggests that will social distancing (staying a distance away from people in public) may be valuable, lockdowns (staying in your home) is not.
You might say there have been 2 primary models for dealing with the pandemic in the last month after we’ve flattened the curve, but have not brought the numbers down, at least not in the US. I’ll call those models the Lockdown and the Re-opening models. Some want to continue the lockdowns to keep everyone safe from the virus, others want to re-open right away without restrictions. For several weeks, I have been gravitating toward a third Adaptive model. Of course, there can be many flavors of this model. Personally, I think masks, even bad ones, are far better than nothing, especially when worn by everyone, and can help us get back out of our houses and help us re-start the economy with reasonable safety. So I’m very open to the idea that the lockdowns have not been beneficial. Some of you will disagree.
The JP Morgan study is at odds with the endcoronavirus.org study, which recommends brief, very strict lockdowns. It could actually be that these 2 studies actually agree, depending on the time frame you’re talking about. I do think the lockdown was very helpful in the initial “boom” stage of the epidemic here in the US, but may have lost its usefulness later.
The Moral Matrix: ZDoggMD is a physician and medical YouTuber with a very silly screen name, but who posted VERY interesting video on how different people see the pandemic we are all facing. Using Jonathan Haidt’s work on the Moral Matrix, he talks about how different people’s moral framework shapes how we are viewing different efforts to address the issue. I was aware of Haidt’s work, but not had yet applied it to the pandemic in my mind. As someone who is sometimes exasperated with people who disagree with me (as they are with me I’m sure), this video is helping me remember to see their point of view. If you’re exasperated with your friends or family, I HIGHLY recommend you watch this video.
Upsurge in the Southern Hemisphere: Lastly, I just want to mention that many countries which have been relatively little effected until now, are now experiencing a big upsurge in cases. These countries include Russia, Brazil, and Mexico, and many are in the Southern Hemisphere, which is in the late Autumn months right now. Let’s hope they are able to get things under control quickly.
Don’t fear, but be smart!
Erik
PS. We went hiking in nearby Calaveras Park today for the first time in months, without our masks. There were a lot of people on the trail, and most were well behaved. When I can’t avoid someone on a narrow trail, I use an old SCUBA diving trick for ascending without getting the bends. Just close your mouth and blow slowly out of your nose as you pass someone. You’ll gently move any virus away from your nose! To maintain my friendliness, I greet people early, with plenty of time to start this little maneuver!
On Wednesday, San Diego County announced that the county will be moving further into California’s Step 2 re-opening plan. This means restaurants will be opening for modified seating with some other restrictions, and many more businesses will able to open as well. To sum, customers will still need to maintain 6 ft separation, and everyone will need to wears masks while shopping. Restaurant guests will need to wear masks while not at their table. Tables in restaurants will need to be moved so that seated customers are at least 6 ft apart. Tables that cannot be moved will need to have barriers between them. Restaurants can also expand outdoor seating!
I’m excited for this change, but it will be important for the public to follow these new guidelines. We want to keep making forward progress!
This is a case update for the previous week. As we’ve seen before, new cases in the US are slowly trending downward (currently around 21k confirmed cases per day), slowly trending upward in California (around 2k confirmed cases per day), and flat in San Diego County (around 125 confirmed cases per day). As we discussed from statistics last week (May 12th post), many of these are likely real cases, and not just because of additional testing.
Active cases after 5/15 are based on data released by San Diego County. Points previous to 5/15 are calculated based on the assumption that recovery time after detection is 16 days.
Rt Live reports that all but 2 states have an Rt value below 1.0, meaning that the virus is slowly disappearing in that state. You may notice if you look on that site, however, that several states, including California, still have slowly upward trending cases, even though they have an Rt value below 1.0. This appears to me to be a discrepancy. Possible explanations for this may be that the Rt Live’s algorithm is too generous and miscalculates Rt for some states, or that the Rt value needs to be much lower than 1 for a downward trend to be seen. We can certainly hope that we will see improvement in these states soon.
Some counties in California will be able to move further into Step 2 of re-opening (Step 2b?). Unfortunately for many of us, none of these counties are in Southern California!
My friend who works at San Diego County Public Health, Brit Colanter, has posted an update slide deck that the County has released, and will update regularly. The county is continuing to have more testing available to the public and is now releasing the number of recovered COVID patients. As of last night, total confirmed cases in SD is 5946, and current active cases is 1926. So more than half of our confirmed cases have recovered! That’s great news!
As we continue into recovery and more businesses open, please continue to wear masks in public, and continue to distance whenever possible! The CDC was slow to recommend masks, and it’s true that masks are not 100% effective, but if everyone is wearing masks that are 50% effective, this will go a long way toward minimizing transmission. See my May 5th post for more info and for mask designs! I’m a big fan of wearing masks in public, and it may be the key to opening more businesses.
The more we keep new cases low, the faster we can continue the re-opening process!
I have a variety of resources to share with you today.
Re-opening: First, after many states have started to re-open, Rt Live is showing that all but 3 states have an Rt value below 1. This means that for most states, each infected person is passing the virus to less than 1 other person, and the virus is slowly disappearing in that state. The states with an Rt above 1 are Minnesota, Maine, and Nebraska. After a poor initial response, I’m happy to say that New York State is doing very well now, and daily new cases are low in New York. In California, my home state, the number of new cases is flat, approximately 1700 cases per day since the middle of April.
How many real new cases? This is going to be a little mathy! I told you I was going to start tracking the number of tests, and I have been doing that since April 27th. This will help us know how many of the new cases are just because of more testing, and how many are actual new cases. I’ve plotted the new cases against the new tests. For each day, a point comparing the new cases and new tests is shown. If new testing matters, then a day with a high number of tests will also have a high number of new cases. To find out if this pairing exists, we can do a statistical test called the R2 test (pronounced “R squared”, also called the correlation coefficient). This test creates a best fit line with the data and that creates an R2 value. This value is a measure of how well the 2 parameters (new tests and new cases) are correlated. I show a hypothetical graph in which the 2 sets of data are well correlated. A perfect correlation will have a score of 1.0, while a set of data with no correlation at all will get a score of 0.0. For scientists (at least the ones in diagnostics, like me) a correlation is considered “true” if the R2 value is above 0.95. You could also say that the correlation is 95% likely to be true.
Now on to our data. I started plotting on April 27th. 5 days later, the graph for the United States got an R2 value of 0.6559. This suggests that new cases and new tests are 66% likely to be correlated for this time period. In real world terms, this probably means that some new cases are because of new testing, but some aren’t.
Interestingly, as of yesterday, a graph like this for the US gets an R2 value of just 0.0117. This is very low and suggests that there is now no correlation between new testing, and new cases. This means that new cases we see now are probably “real” new cases, and not just pre-existing ones that are just being found because of new testing. For California, the correlation between new cases and new testing was never very high. Right now, the R2 value is only 0.0039 for California, suggesting that most new cases discovered are “real” new cases. What this means going forward is that we probably have enough testing now to locate new cases. As we go forward, I expect we will start to see a steeper decline is new cases.
Good news! This good news comes with a warning, however! Those living in the West will easily understand a comparison to a brush fire. Right now, we are in the “containment” stage. We have the fire surrounded, and were at the beginning of the end, but if we walk away now, the fire will start to spread again. We need to stay on task and keep fighting the fire! I am all for re-opening, but we need to remain diligent. Wear a mask when you go out into public, and continue to keep your distance from others! If your workplace re-opens, you will probably want to wear a mask, wash your hands frequently, and sterilize your workspace often. I am probably going to start traveling for work again soon, and I’m very glad that everyone will be wearing a mask on the plane!
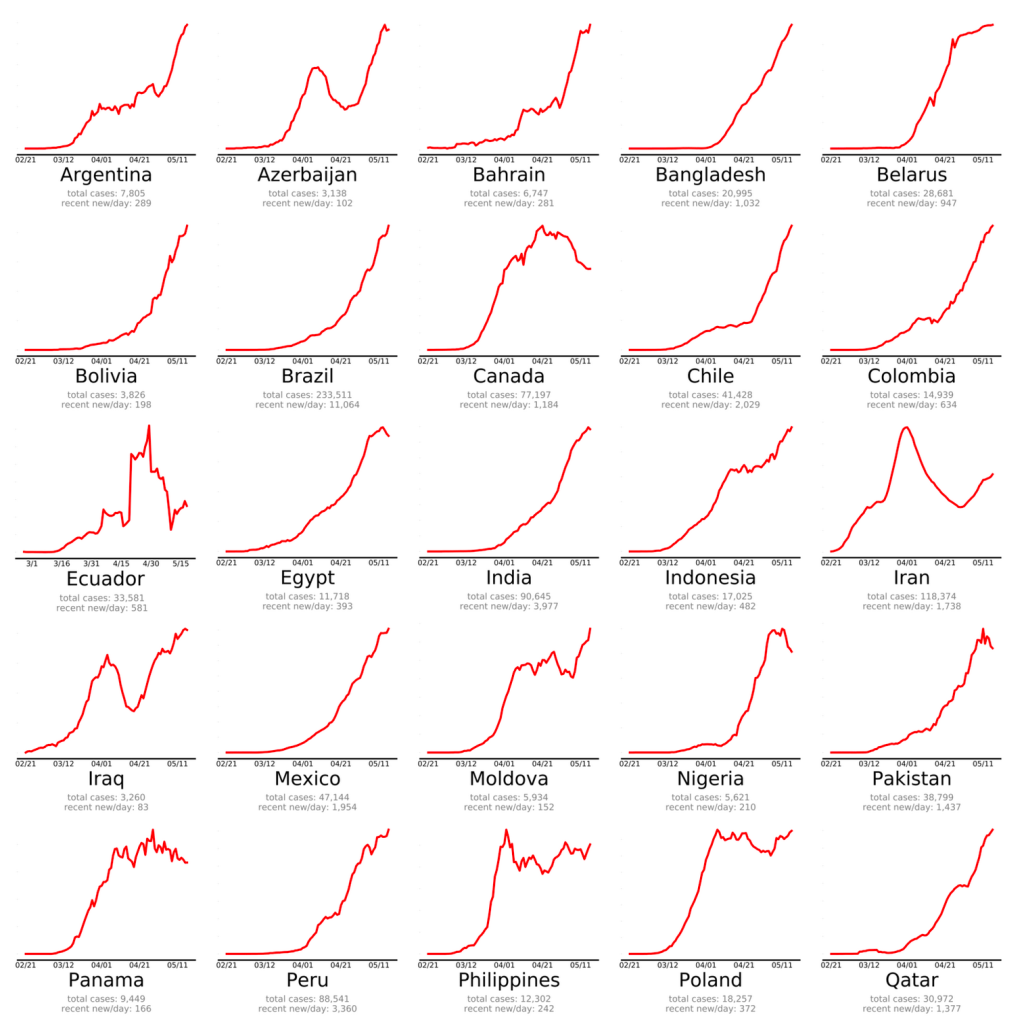
Endcorona.org compares responses: I discovered a new website the other day, endcorona.org, from the New England Complex Systems Institute. The group compares the responses and results from different countries. First, “green” countries responded very well, and were able to get the virus under control quickly. Aside from the good response, I also notice that most of these countries have relatively small populations. You may notice that China also appears on this list. Most experts agree that the data coming from China is not reliable, and they probably have many more cases than they are reporting. After intermediate cases in yellow are countries in red that need more action. This includes the US. If you’ve been reading my posts, you’ll recognize the “flat” curve of the US. Yes, we’ve flattened the curve, but we haven’t been able to knock down our case load yet. Other countries with similar flat curves include Canada, Finland, Indonesia, Panama, Poland, Sweden, and the UK. Other countries had low cases at first, but are now experiencing explosive growth in new cases, including Brazil, Mexico, and Russia.
After analyzing the responses of these countries, endcorona.org recommendations include the following, many of which you’ll recognize:
Lots of testing to identify new cases.
Isolating infected individuals, even from family members!
Strict lockdowns. The stricter the lockdown, the shorter it will be.
Travel restrictions, even within the same country.
Adequate health care capacity.
Safe practices for essential services.
Masks in public for everyone.
Viral spread: Erin Bromage, an Associate Professor of Biology at U Mass Dartmouth, has a very nice article on his blog describing how the virus spreads. It is well written for non-scientists and has lots of links to original research. The take home lesson is that the virus spreads particularly well in-doors. In addition, cough, sneezing, and to a lesser degree shouting, singing, and even talking are all risk factors in spreading virus.