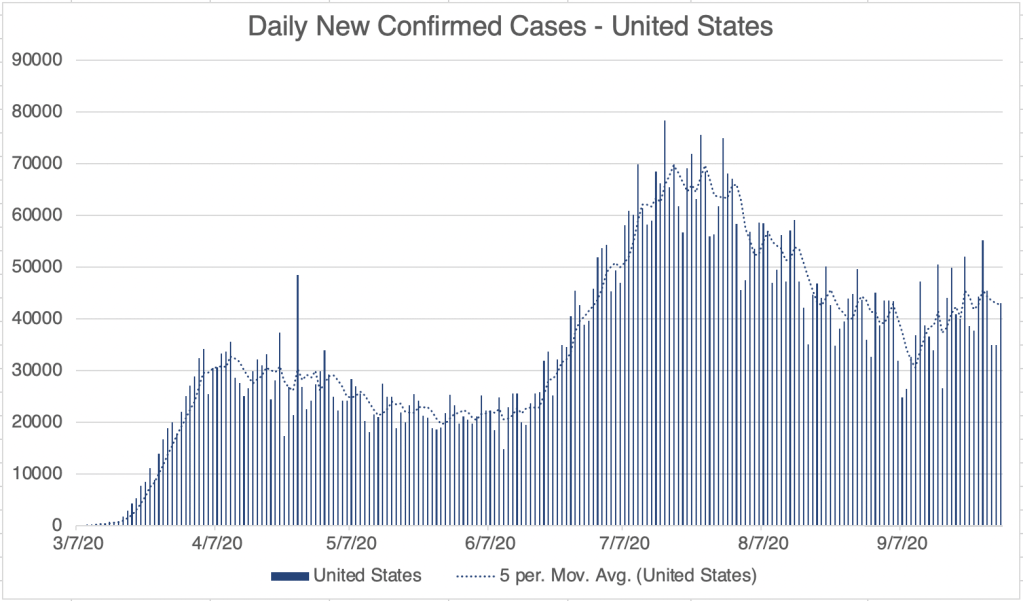
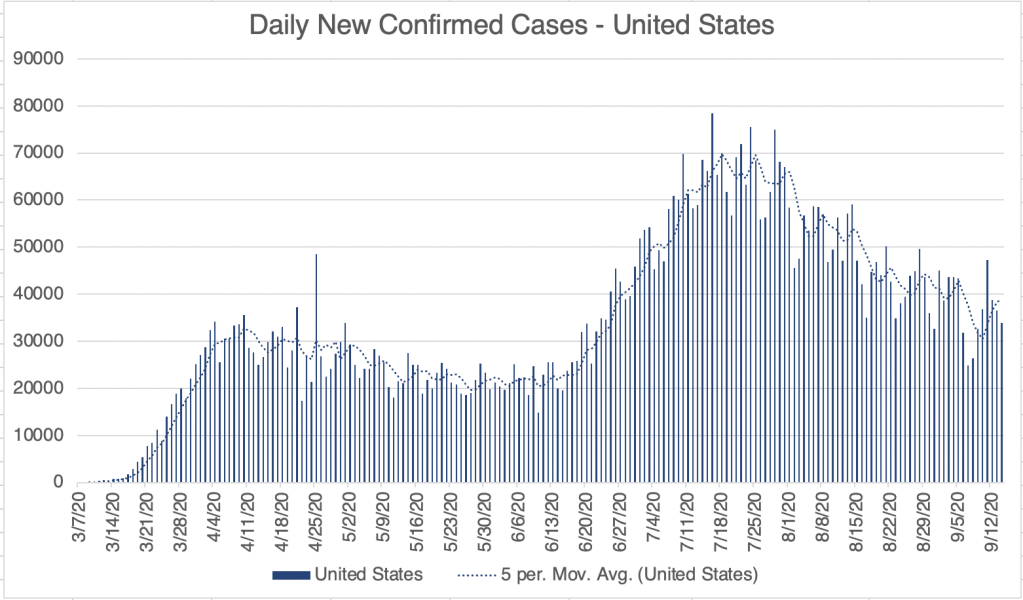
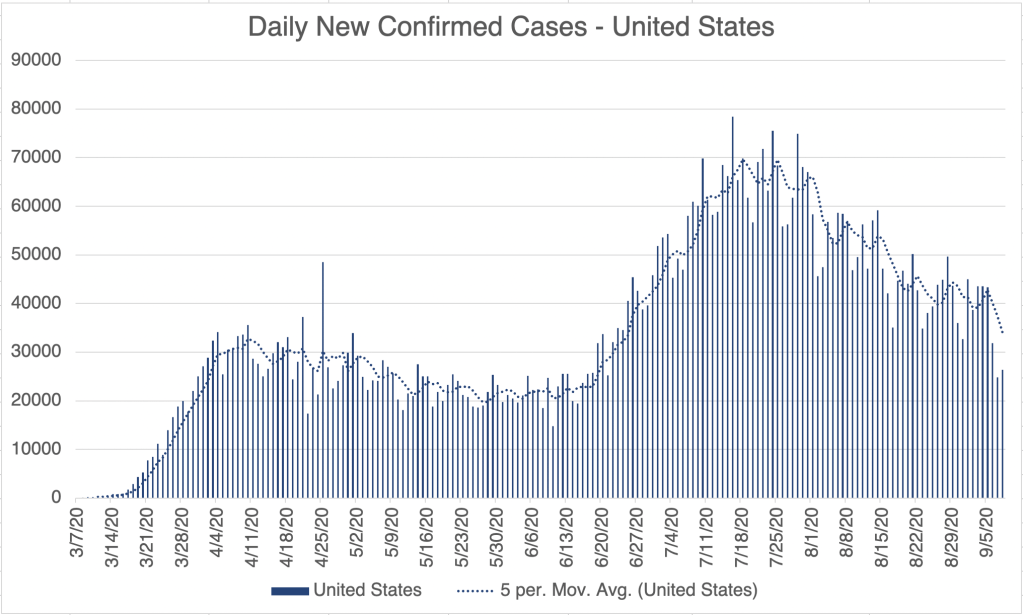
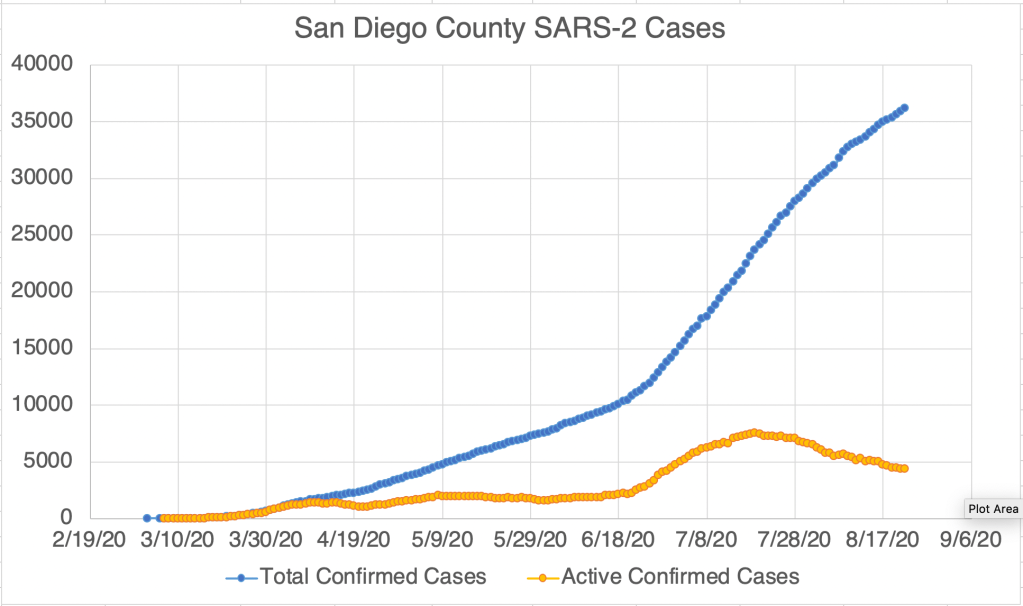
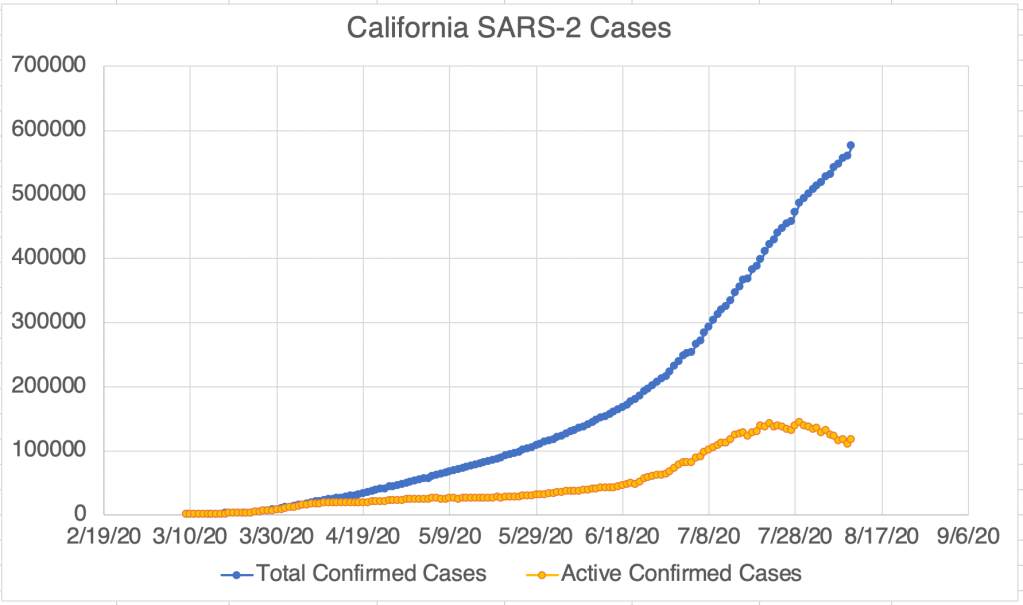
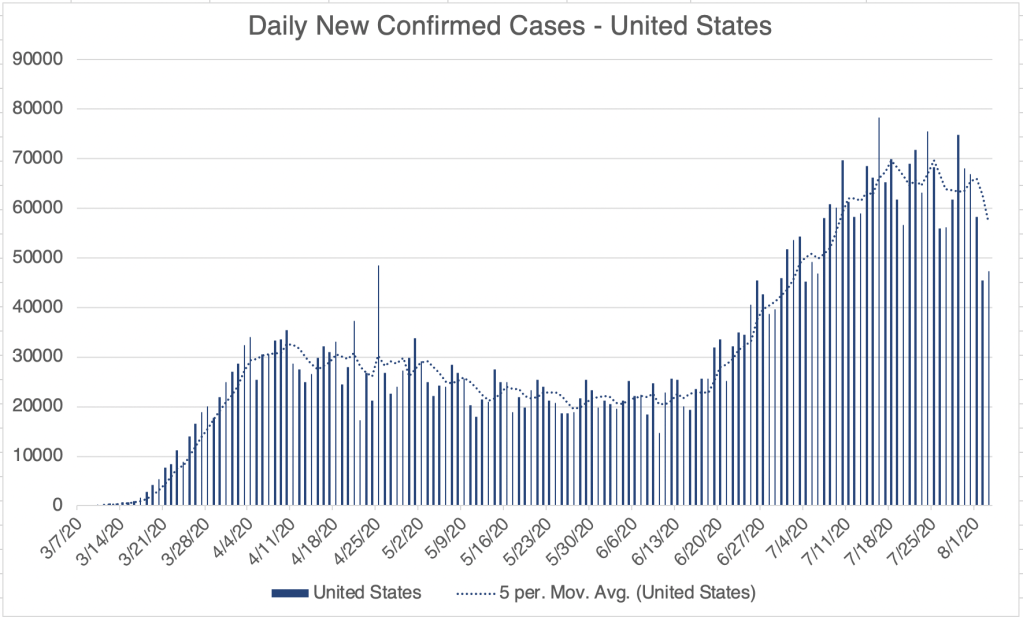
Here’s an update for today. The US, California, and San Diego County seem to have reached a “new normal” after the 2nd wave is over. All have a persistent rate of new cases, unfortunately higher than when the 2nd wave started. The US in fact is increasing in cases a little, with the Northern states having the largest new confirmed case load.
India now has 6.1 million cases as compared to the USs 7.2, and they are just reaching their first peak now, so they will probably surpass our case load soon. This is confirmed cases of course, and there’s no telling now many non-detected cases they have. Of the countries with the top 10 number of confirmed cases, 4 are in South America, Brazil, Colombia, Peru, and Argentina. Mexico is also in the top 10.
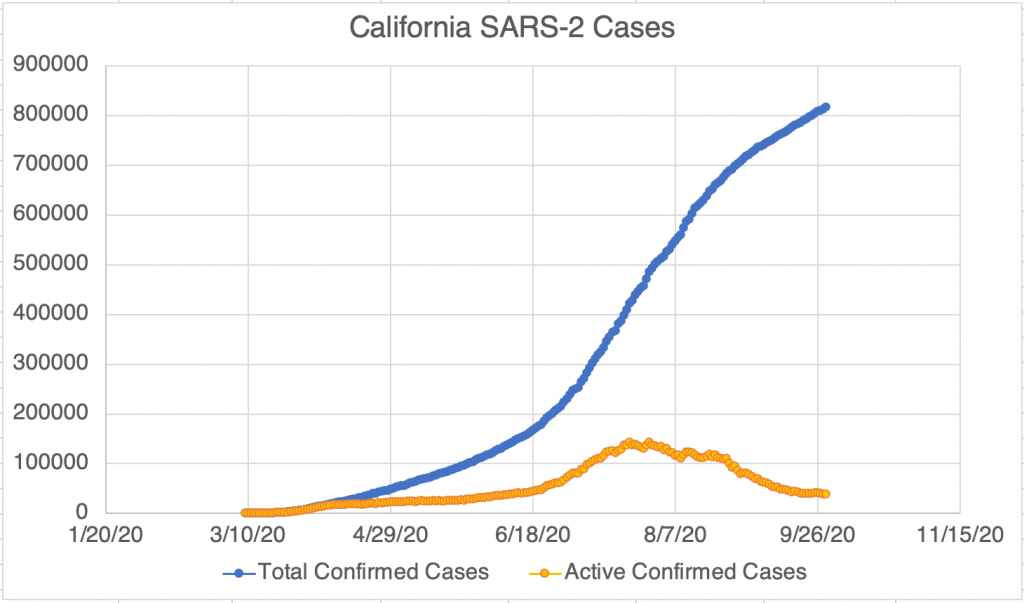
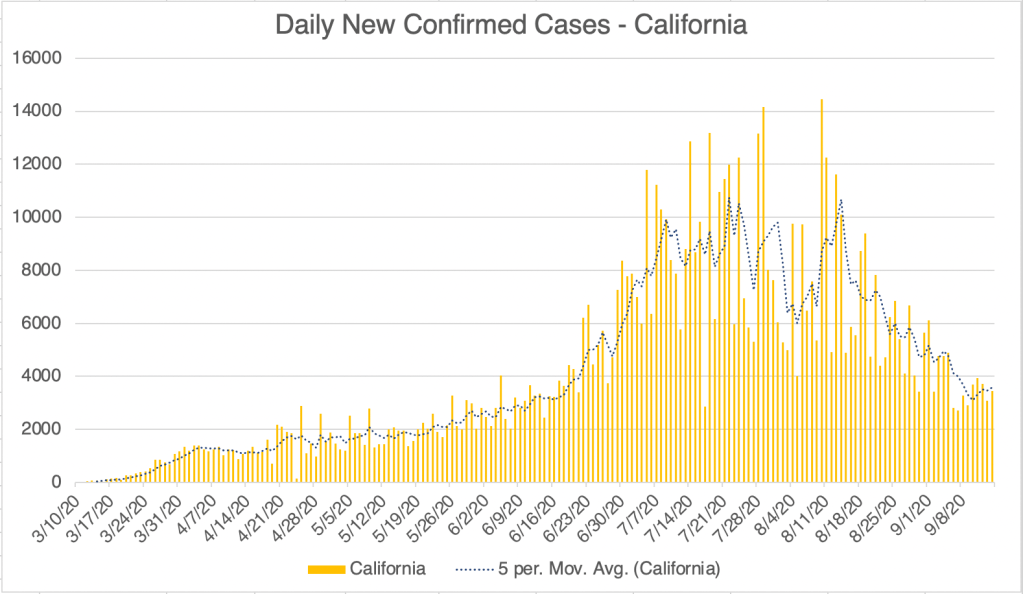
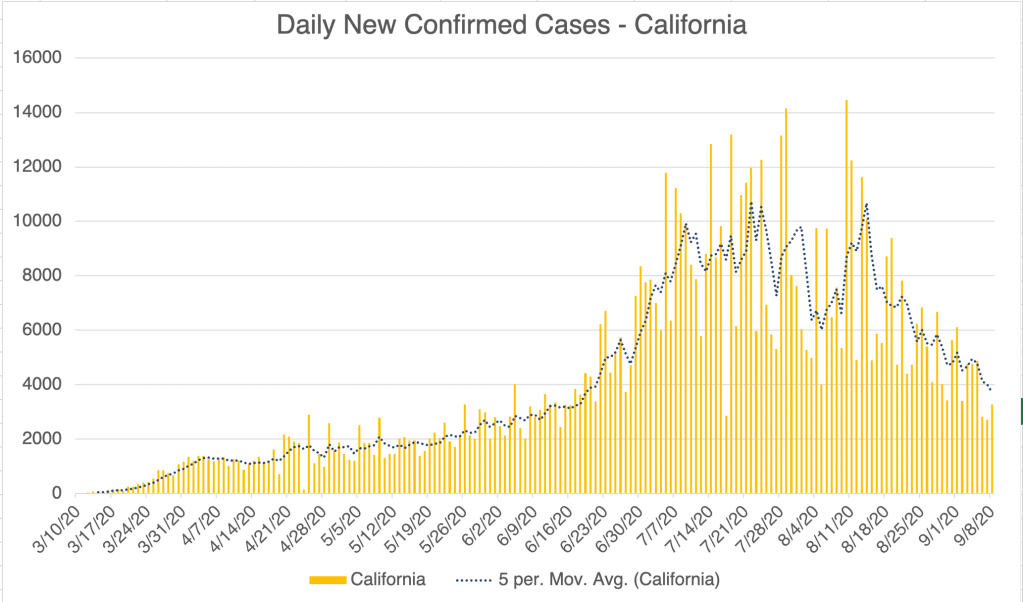
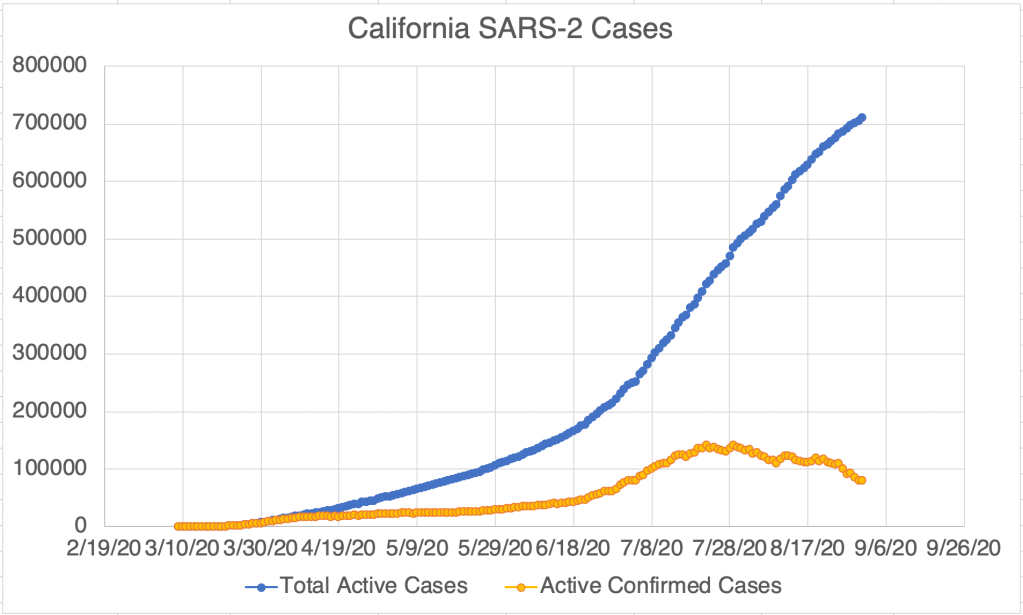
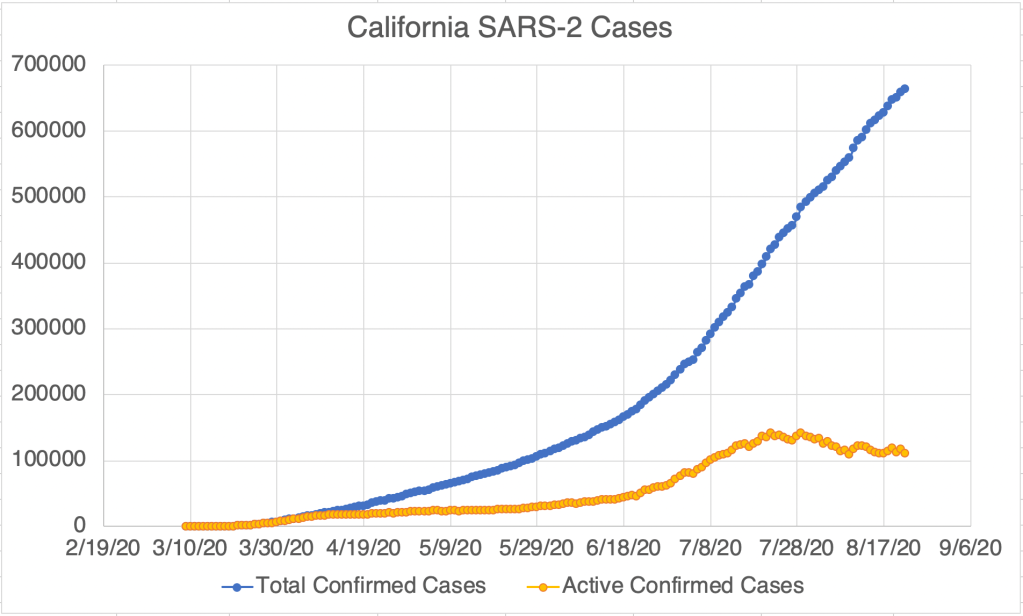
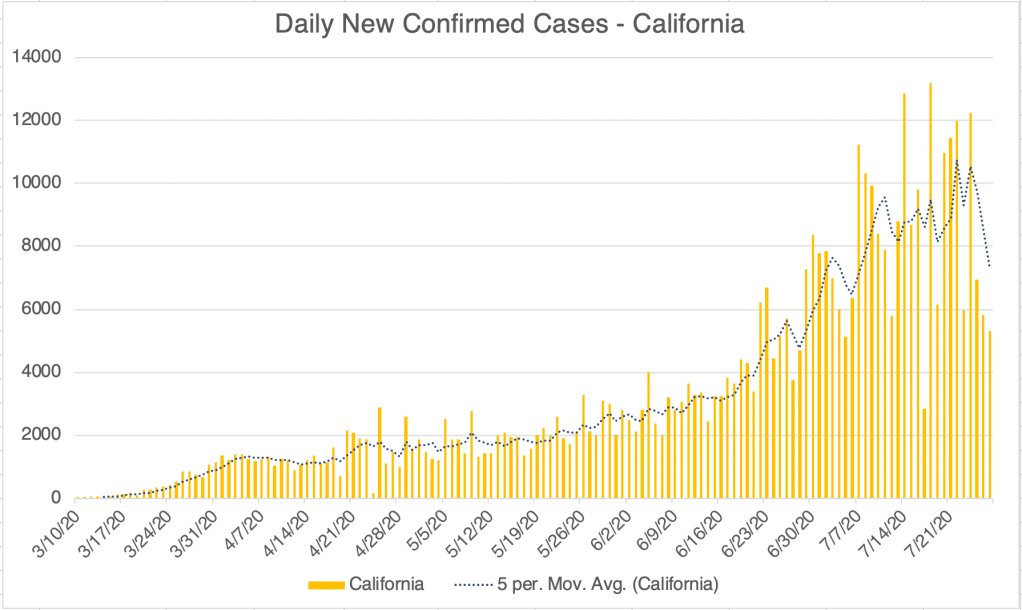
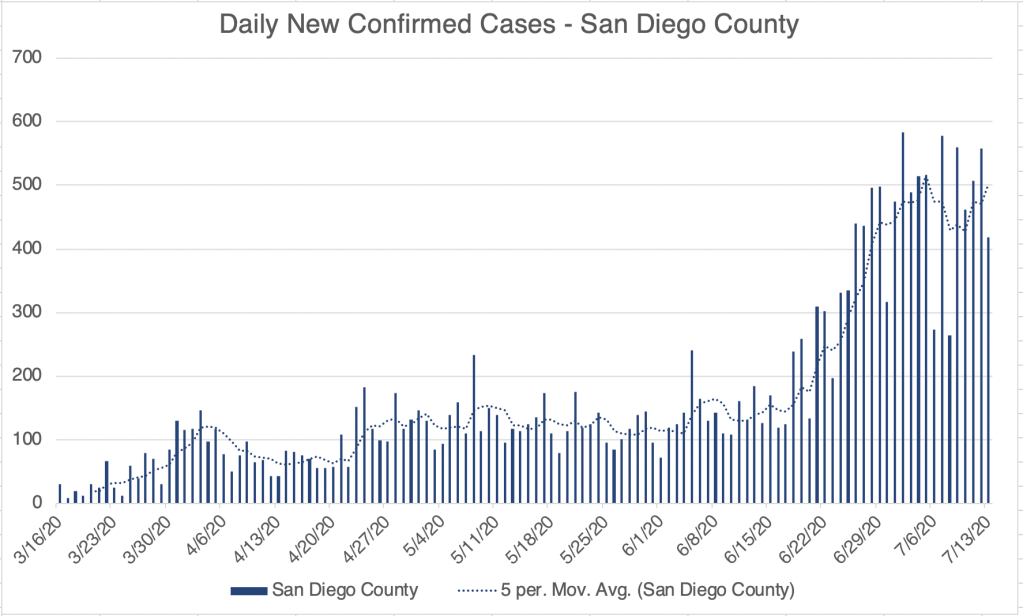
Friends, This is a virus update. I’ll also have a few comments regarding the recent Bob Woodward book. New confirmed cases continue to drop for the US, California, and San Diego. California new case numbers are back down to what they were before the 2nd Wave hit in mid June.
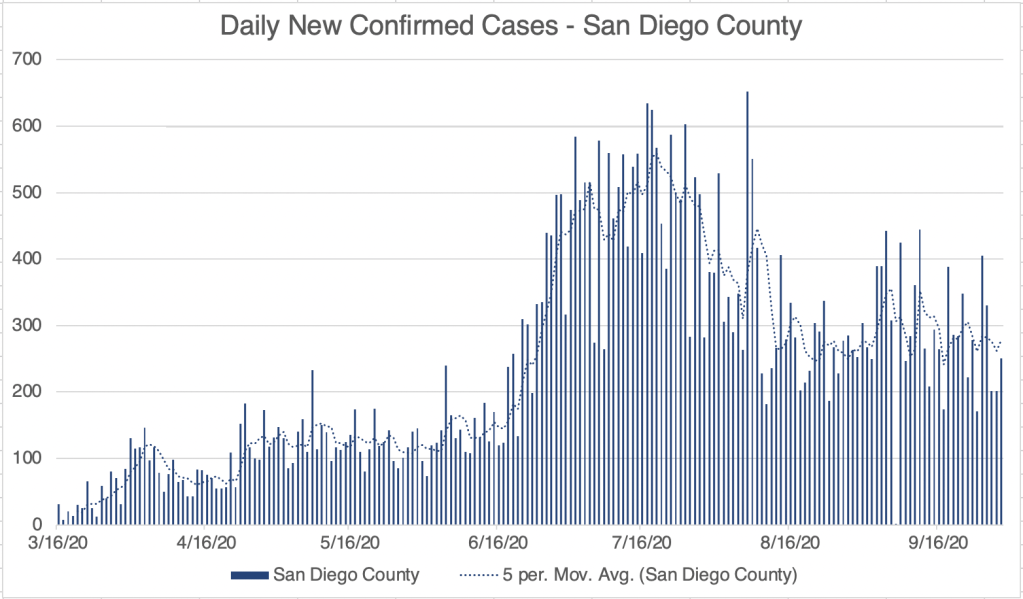
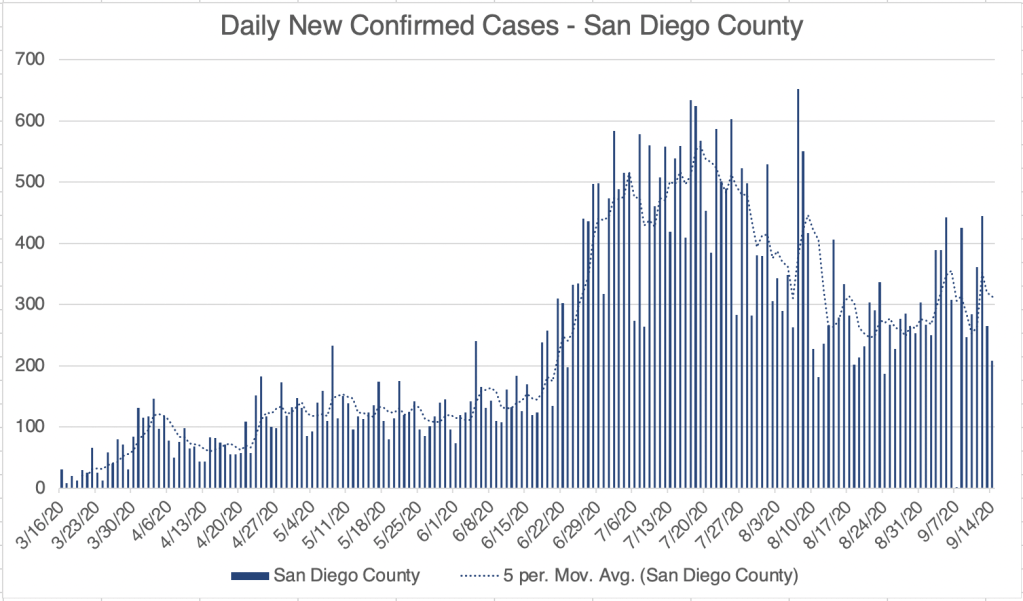
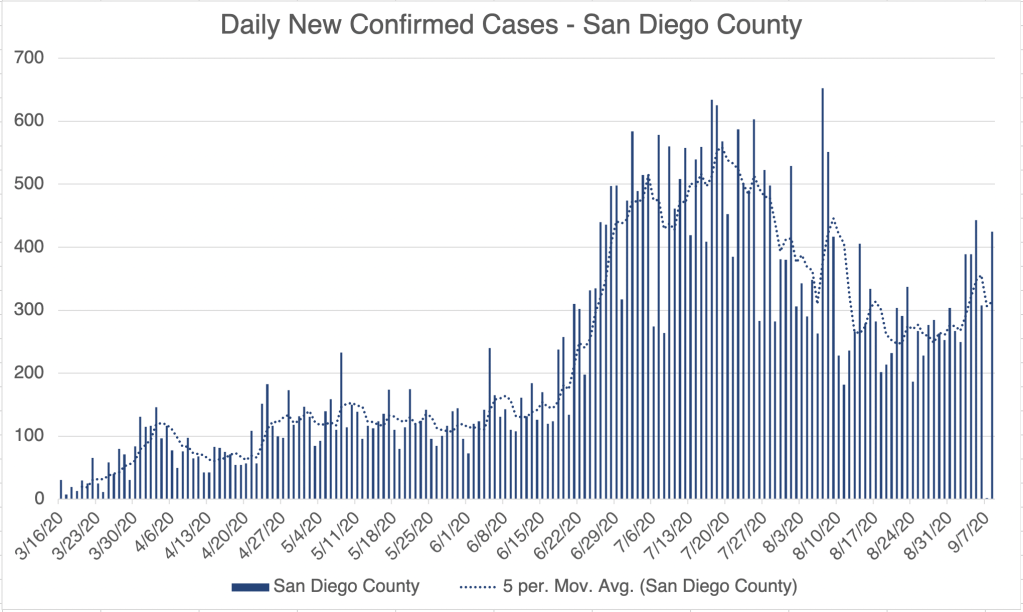
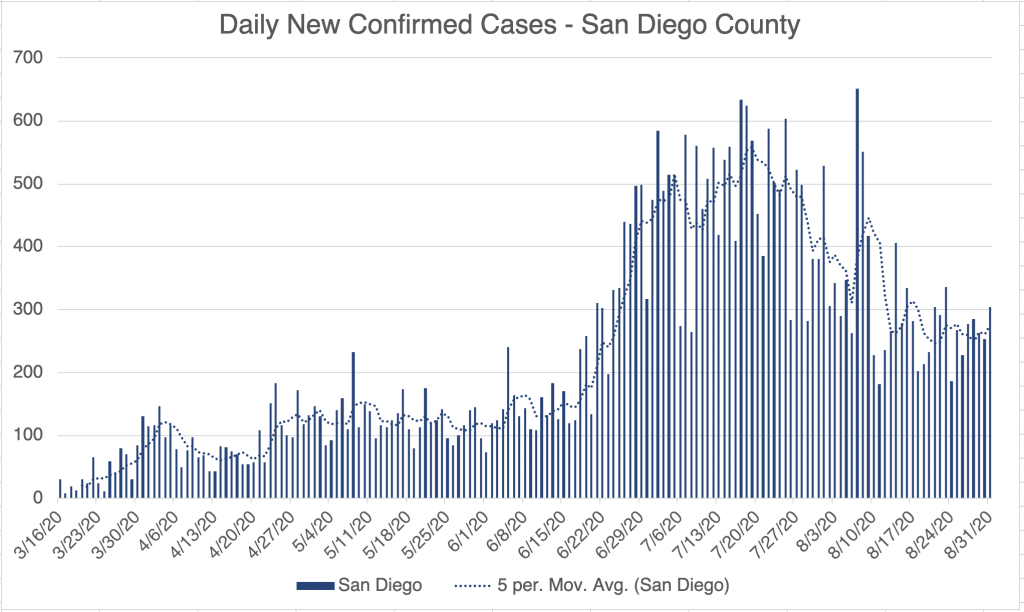
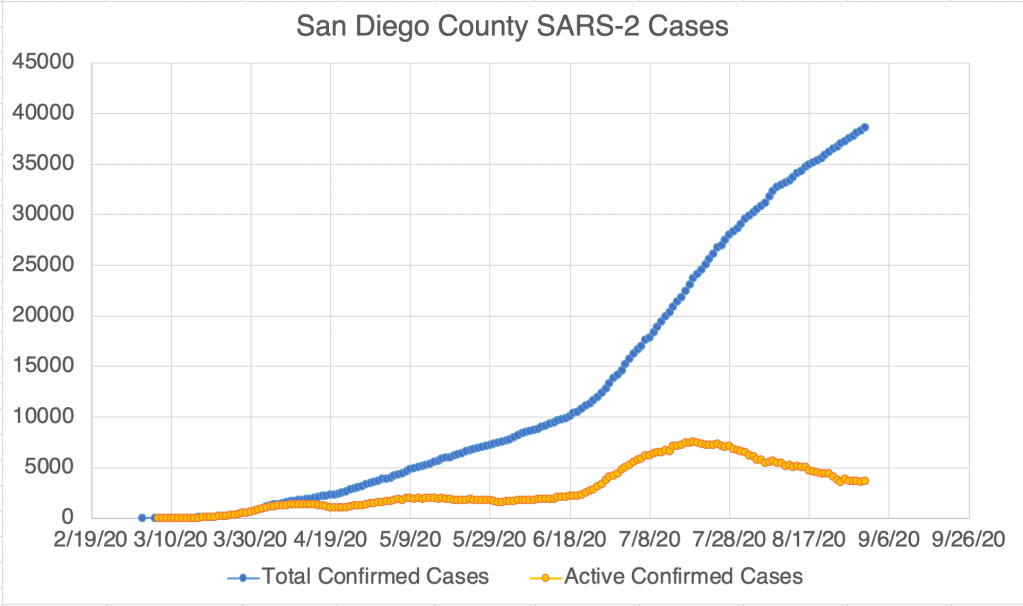
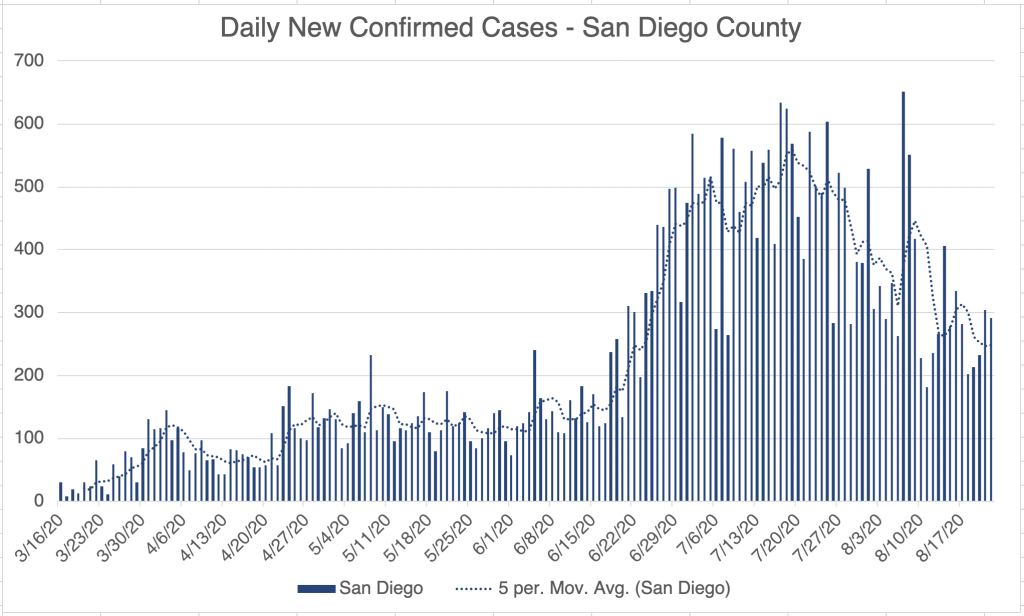
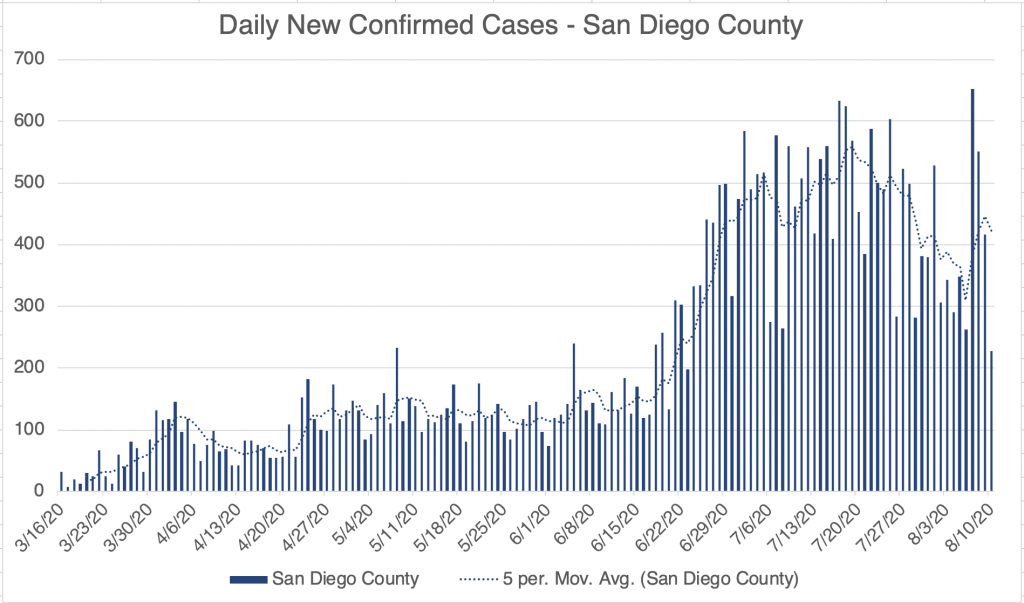
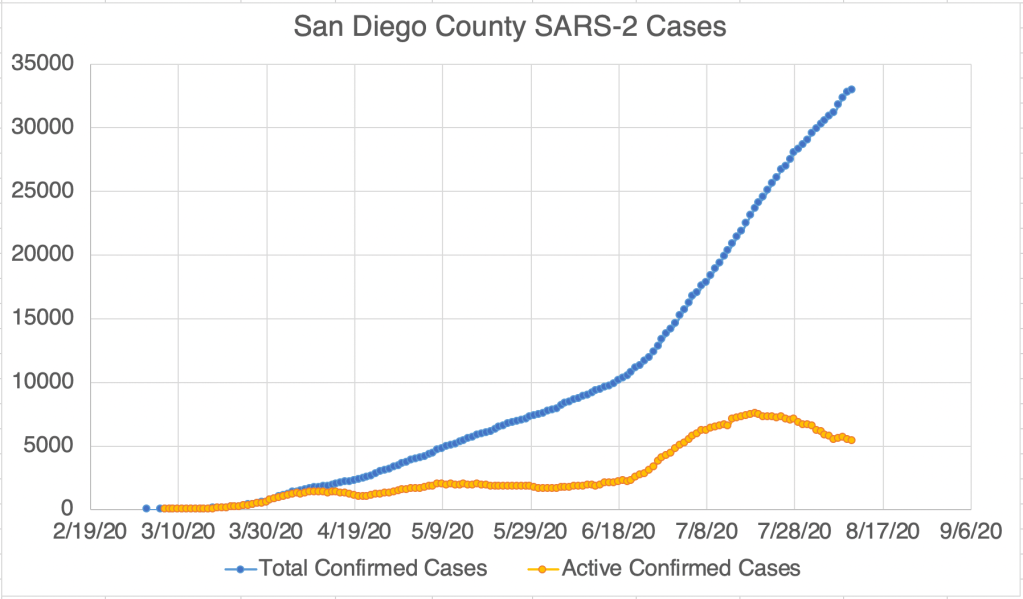
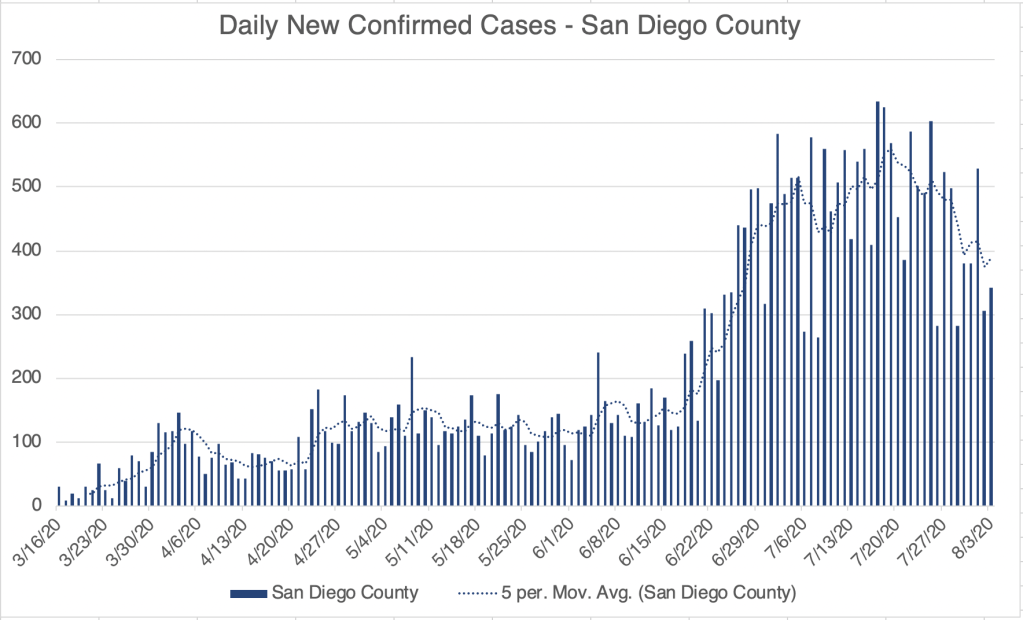
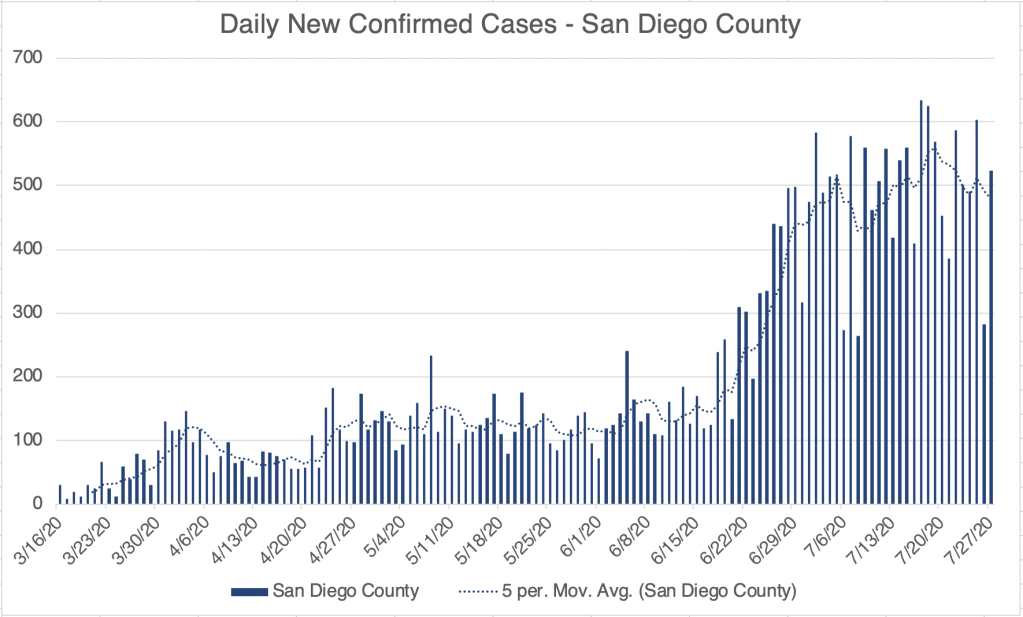
San Diego had a moderate sized outbreak at SDSU in the last few weeks which created a spike in new confirmed cases for the County, but those numbers are coming down as well.
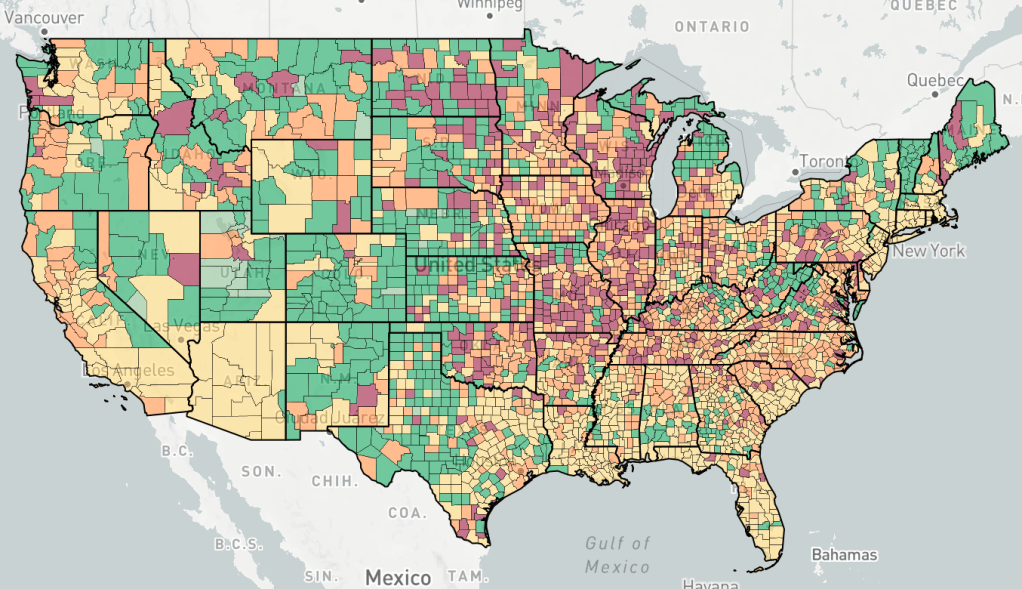
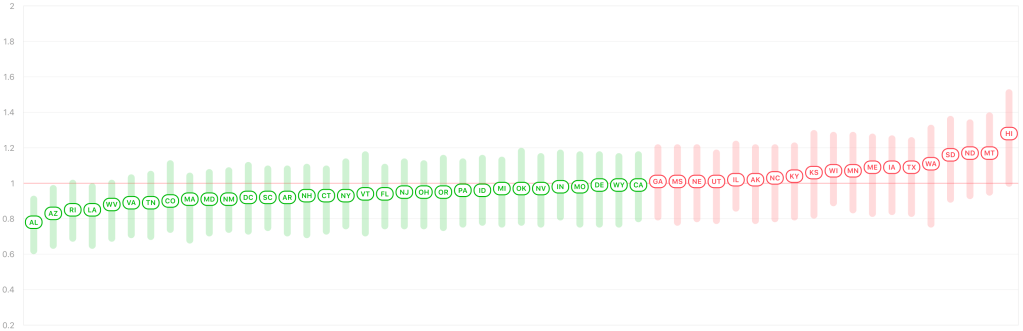
Endcoronavirus.org’s county view map now shows mostly yellow across much of the South, including California, Arizona, Texas, Louisiana, and Florida, which was perhaps hardest hit by the 2nd Wave. It looks like that region is now recovering, and the Mid-West is now the region of greatest concern, with increasing numbers in many Mid-Western states.
Bob Woodward comments: If you’ve been reading my posts for long, you know that I try to keep these posts as politics free as possible, referring to policies, but not to people. You also know that my recommendations sometimes support those commonly from the “left” and sometimes from the “right”. I do my best to pass along the science as I see it, since I believe politics and science are terrible together.
If you’ve read my July 7th post, you know that a major concern of mine is Antibody Dependent Enhancement. This phenomena is still not discussed openly in the media, and the only other commentator I hear discussing it is Chris Martenson of the Peak Prosperity YouTube channel. Tony Fauci has mentioned it only in passing. I have been concerned about this phenomena since February when I started studying the SARS-2 virus.
Why did I wait until July to post about it? In any crisis, there are people who are anxious about it, they are the first to react, and some overreact. There are others who are unconcerned, and react slowly if at all. Many are somewhere in between. Anyone who communicates to the public has to aim somewhere in the middle of these perspectives. My goal from the beginning has been to communicate adequate concern while being as positive as possible and not cause the anxious to over-react. As I’m sure you’ve heard, there have been many mental health issues attached to recent events, and I have friends in the mental health field for whom this is a great concern. I struggled for a long time before my July 7th post. I wanted people to be adequately concerned, but I didn’t want to cause needless anxiety. The ADE phenomena is still poorly understood, and it’s not certain if it will play a roll in this crisis. I finally decided to discuss it because I had a lot of friends who I felt were not taking the virus seriously enough, and I began to feel it was wrong of me to not inform them. To this day, I wonder if I waited too long, or maybe shouldn’t have mentioned it when I did.
All this to say, Bob Woodward’s discussion with the President was in February, if my understanding is correct. In February, the virus had still not come to the US, except for a few small clusters. Little was still known about how it would behave in the US, and the opinion of medical professionals regarding how to deal with it has changed many times since then. If President Trump was wrong to downplay the virus in February, then I was wrong too. I hope you will have some understanding for the difficult decisions to be made.
The CDC continued to treat the virus like it has always treated epidemics somewhere else, deep into March. Only in Mid-March did they allow other entities to do SARS-2 testing in the US, responding to the President’s request. Large scale testing did not start until early April. In my opinion, the CDC is most responsible for reacting too slowly to the virus.
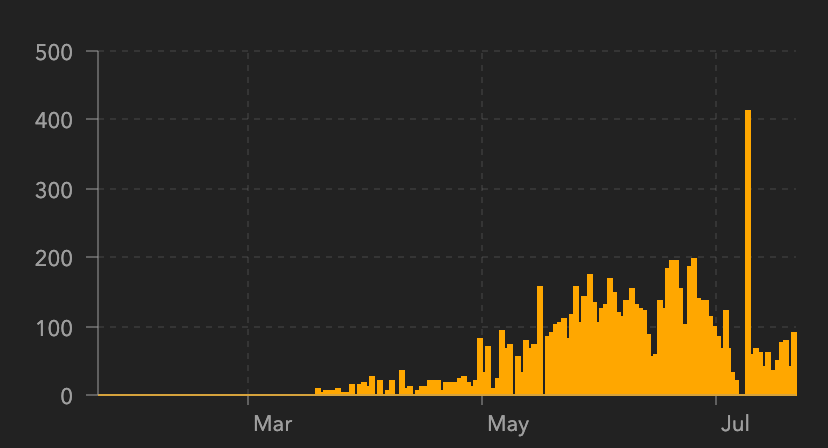
Friends, This is a case update from the last week. For the US and California, confirmed case numbers continue to improve. In San Diego, we seem to be having a small bump in cases right now, after a consistent fall since late July. My friend Brit Colanter who works at San Diego County Public Health tells me that there was an outbreak at SDSU in the last few weeks. 444 cases so far and 1 hospitalization.
I just got back from a trip to a hospital lab in Rochester, New York, helping them expand their COVID testing. As much as we can grumble about conditions here in California, they are even more strict in New York. New York has a quarantine program going for residents of some states, including California! I was required to check in with Contact Tracing every day, and stay in my hotel room when I wasn’t at the lab. So I was kind of under house arrest!
I have a new appreciation for Door Dash and other delivery people working out there today. So thanks to all of you who are working hard to bring needed items to those who can’t leave their house! You have important work right now!
Don’t fear, but be smart! Erik
PS. I’ve heard a rumor that many African nations are having official events to pray for the US. Many thanks to my African readers for your prayers. We certainly need them!
Just got home from some traveling, setting up a new COVID lab. Just a quick update.
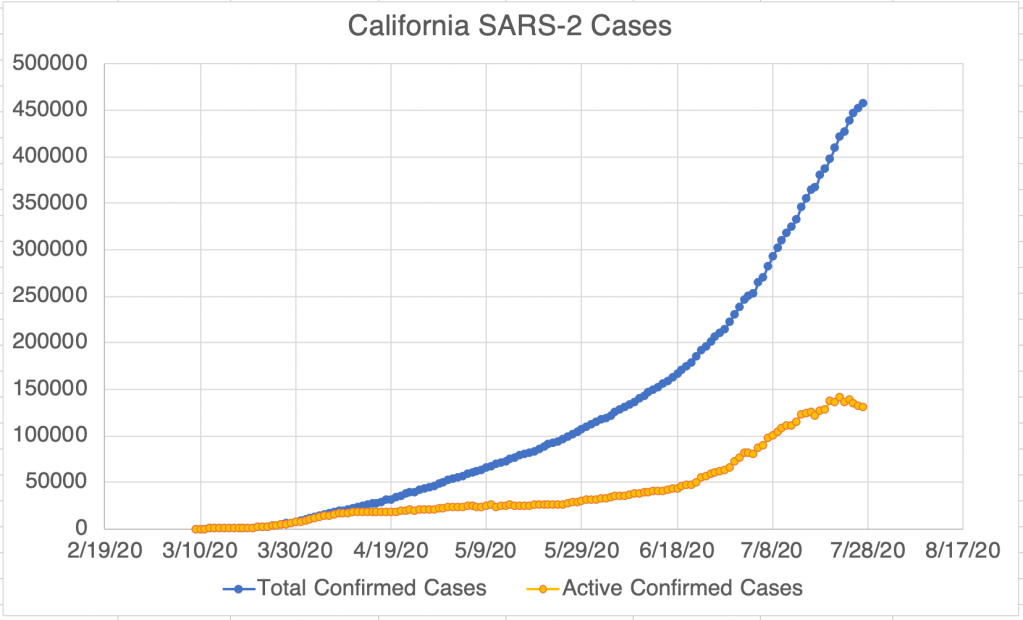
New cases continue to drop in the US, California, and San Diego, as do probable active cases. Endcoronavirus.org counties map shows most of California recovering.
Friends, Sorry for the long wait for a new update, I’ve been helping put together a new COVID lab, and I’ve been working long days for the past week. Today, I’ll give the update, then talk about a new study concerning masks.
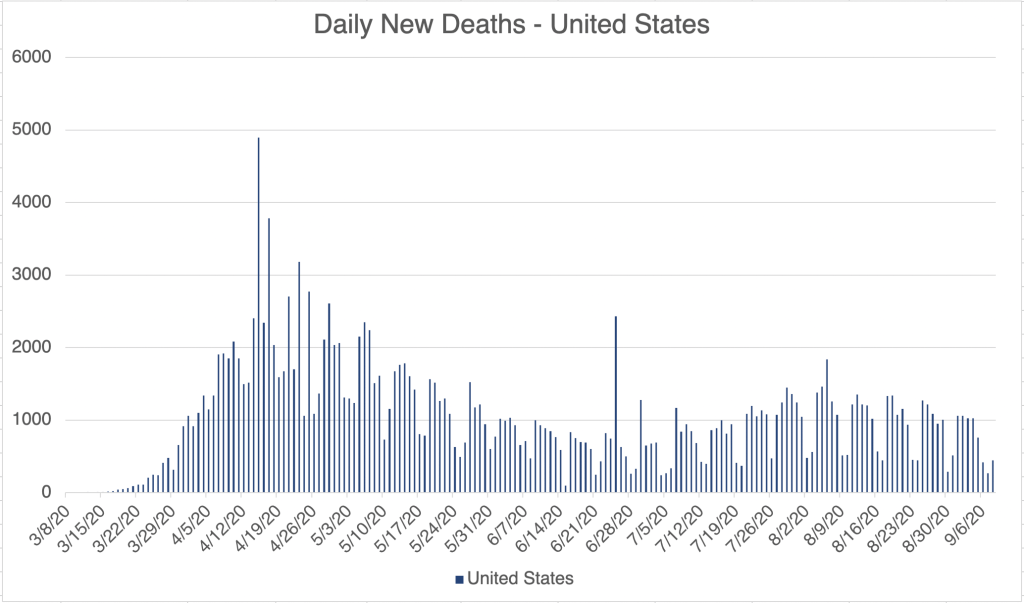
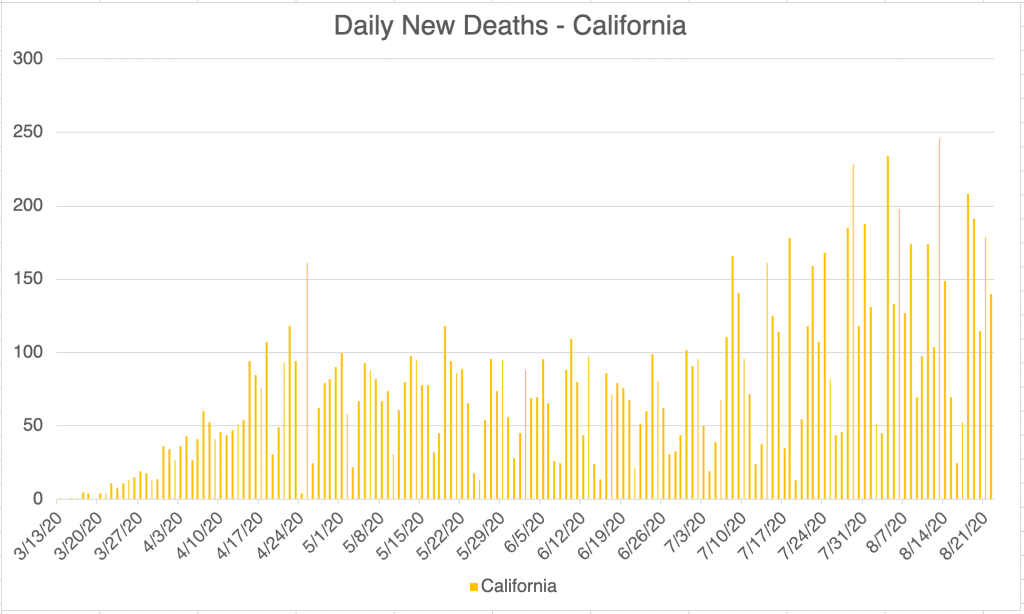
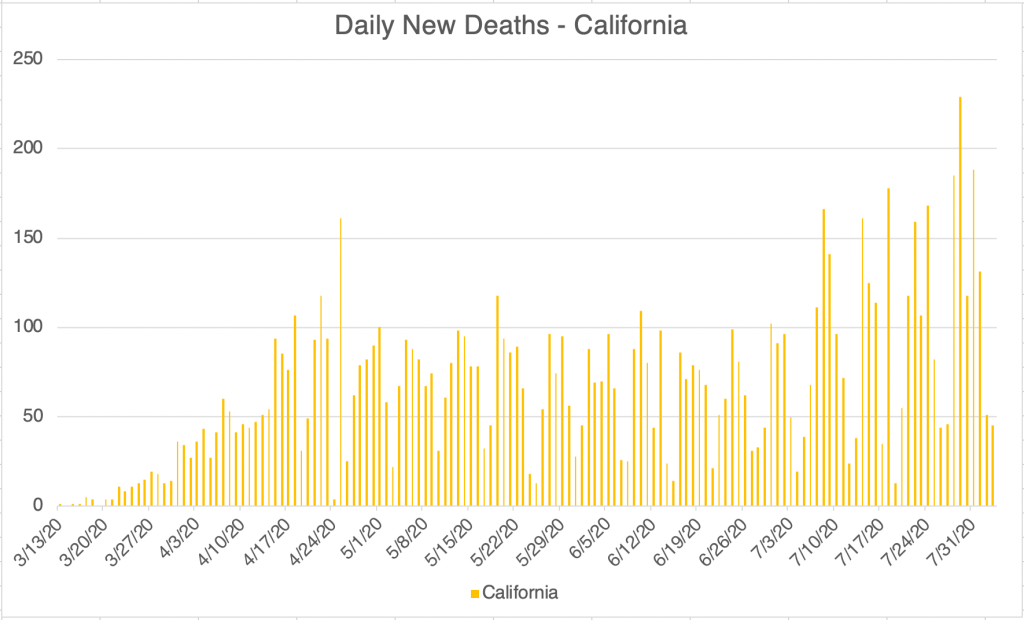
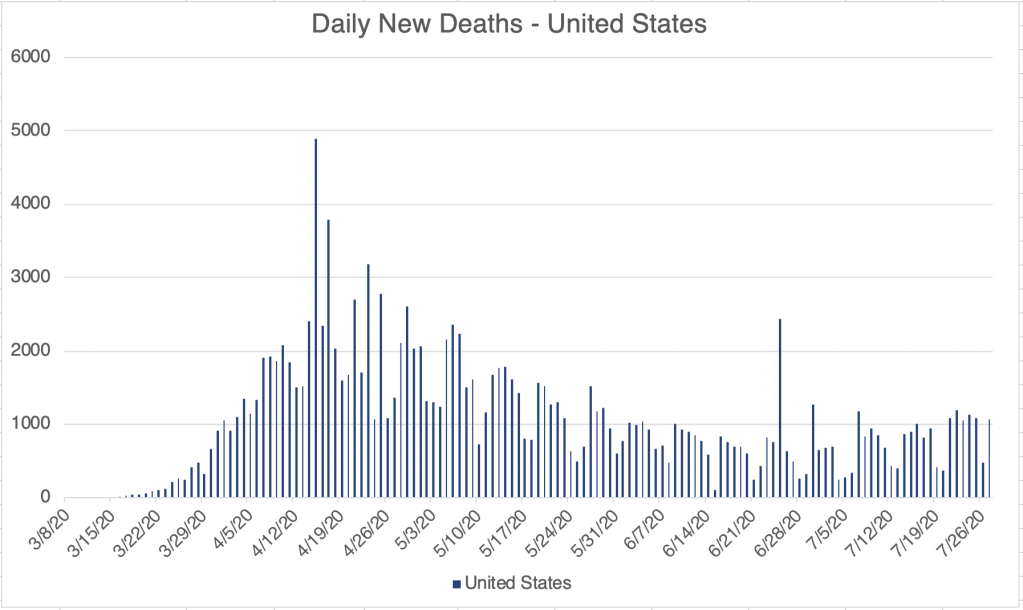
Update: New confirmed cases continue to go down for the US, California and San Diego County. For California, the numbers are kind of flat. The reporting system in California was broken for much of last week, but the state says it’s working again. Death rates are coming down from their second peak. Comparing the new daily case numbers and the new death numbers make it clear that the virus has become much more survivable than it was in March and April.
New study on droplet transmission from various masks: A study was pre-published a few weeks ago that studied droplet transmission from various popular masks (Fischer EP, et al., Low-cost measurement of facemask efficacy for filtering expelled droplets during speech, Science Advances, pre-released August 7, 2020). The study used a system in which a speaker wearing a mask would say a prescribed phrase several times into a box through which a laser was shining. A camera would then capture droplets that were illuminated by the laser. The study used a relative scale for mapping mask benefit, with the N95 getting a relative score of 0, and no mask at all getting a score of 1. See the results in the photos.
Surgical masks did the second best after the N-95, and a 2 ply cotton mask with a sheet of polypropylene (like blue Shop Towel) fabric did third. I’m particularly happy to see the cotton and poly mask do so well, because that’s what I use! Performing poorly are knitted masks, bandanas, and especially the neck gaiter, which actually did worse than nothing! The authors speculate that this is because the fleece material may break up larger droplets into smaller ones instead of stopping them.
Shout out to my sister-law Penny who has made hundreds of masks in her home. The 2 ply cotton masks she makes have a pocket for inserting a filter or piece of poly like I use, and these masks did very well in this study! For extra credit, say the phrase “masks she makes” ten times fast.
I have never been a fan of the surgical mask because of the large side spaces that allow air to pass easily into and out of the mask from the side. I was surprised to see these masks do so well in this study. The answer may be in the experimental design, which captured droplets coming from the front of the mask, but excluded ones from the side. I would like to see a study that captures that too! This just shows that experimental design matters, and just because a study shows something, doesn’t mean the study was designed to detect all relevant things!
Mask wearing has become controversial, but the data supports the idea that masks reduce viral transmission, and that lower viral load on exposure leads to better medical outcomes!
Here’s the weekly update. The US, California, and San Diego County continue to improve. New confirmed cases continue to drop. I have to qualify this however, since California had a problem with their cases reporting system for much of last week. It’s back working normally, but cases may still be erratic in number for the next few days. This may impact the San Diego numbers as well.
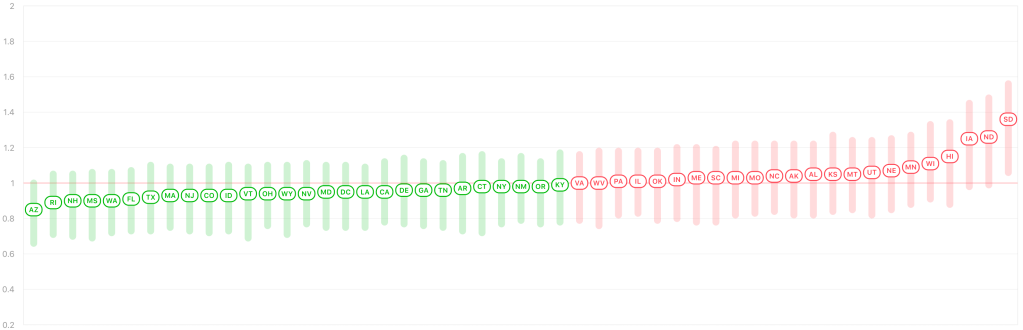
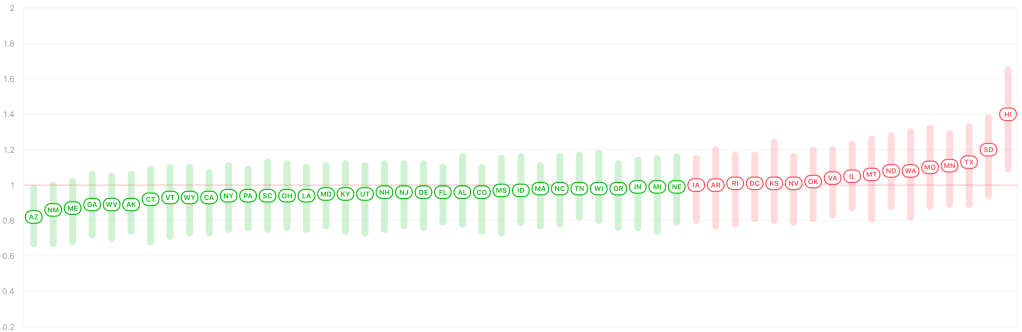
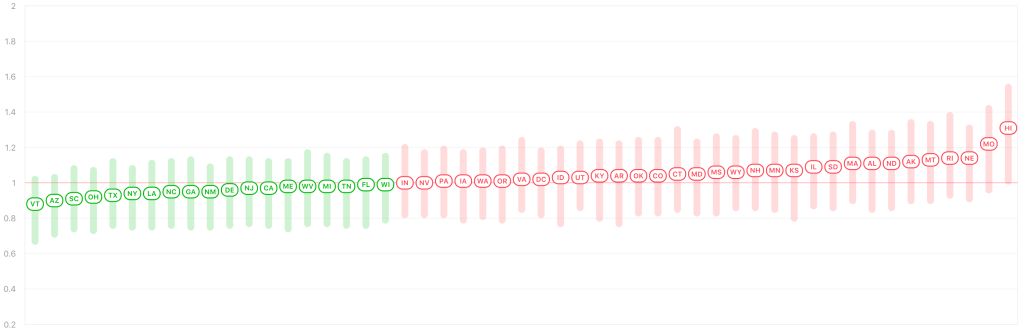
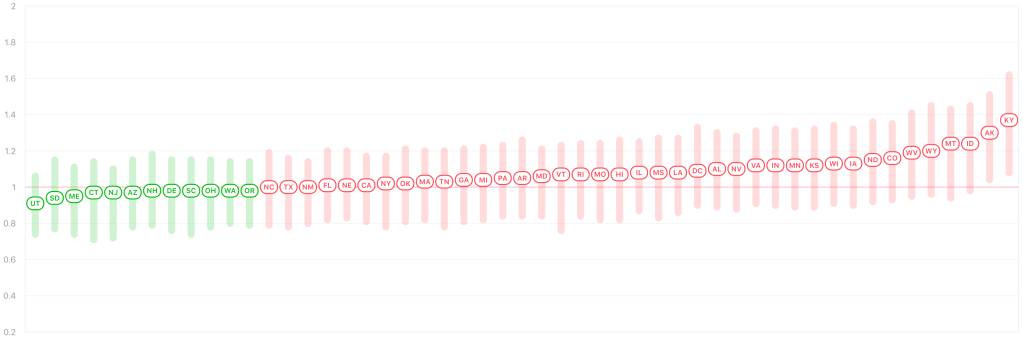
According to Rt Live, more than half the states in the US now have an Rt of below 1.0 again. This suggests that those states are on the downslope of the last peak, and virus is slowly going away in those states. This is great news.
I spoke to testing professional this week who said that viral load, the number of viruses in a patient’s test sample, started coming down in April, when mask wearing became common place. This supports my claim that even if a person gets exposed to the virus, they receive less virus if they’re wearing a mask. This may also be why the virus has been more survivable in the past few months.
I have a grab bag of things to discuss today, starting with the weekly update, a note about the new KN95s, a new version of the Coronavirus (D614G), and where outbreaks are located, at least in San Diego County.
The positive trend continues! Cases are dropping in the US and San Diego, and are flat in California, which is actually better than it sounds, since the state has been steadily increasing in cases since mid-April. Active cases continue to decline in San Diego. Even in Los Angeles County, the epicenter of new cases in the entire country for the last few months, new daily confirmed cases are finally coming down.
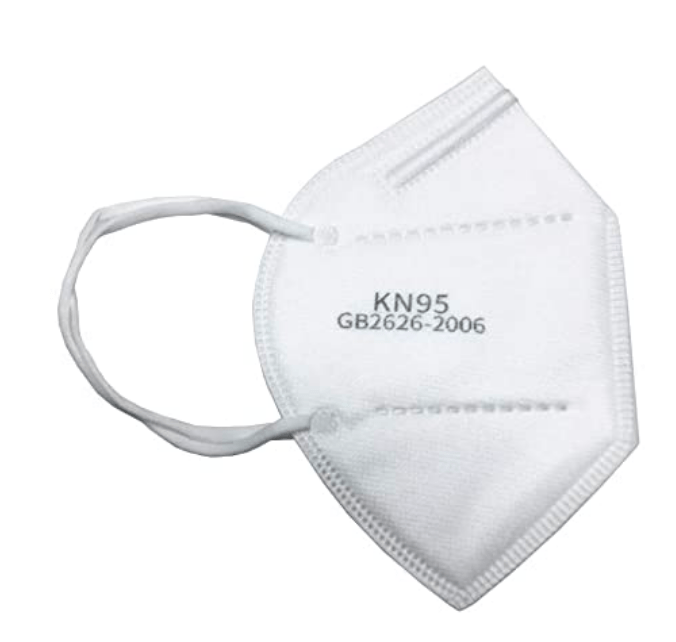
KN95 masks: I’ve started to see a new kind of mask being worn, the KN95. They are rated to filter out 95% of virus particles, but are made and certified in China and carry the European CE mark. The FDA has allowed their use in the US as an emergency measure. They fit a little less snugly than an N95. Perhaps their greatest benefit is that they’re available. If you’re still using a surgical mask consider upgrading to the KN95, which will be an improvement!
A KN95 mask.
New strain D614G: A new strain appeared in the US and worldwide probably in May or June. Called D614G, it carries a mutation at the 614th position of the Spike protein. This mutation makes the virus more infectious by 4-5 times, and may have contributed to wave Ib of the virus that we saw in June and July. Dr. Deborah Birx, White House Coronavirus Response Coordinator, has speculated that this mutation may be why we saw more widespread virus outside urban areas during the last jump in cases.
Coronaviruses are RNA viruses. Enzymes that replicate RNA tend to be very error prone which is why RNA viruses change so rapidly. This is true for Coronaviruses as well as for the flu and for HIV. We can continue to expect more naturally occurring mutations in the future. The good news is, over the course of years, viruses generally become less virulent and more mild.
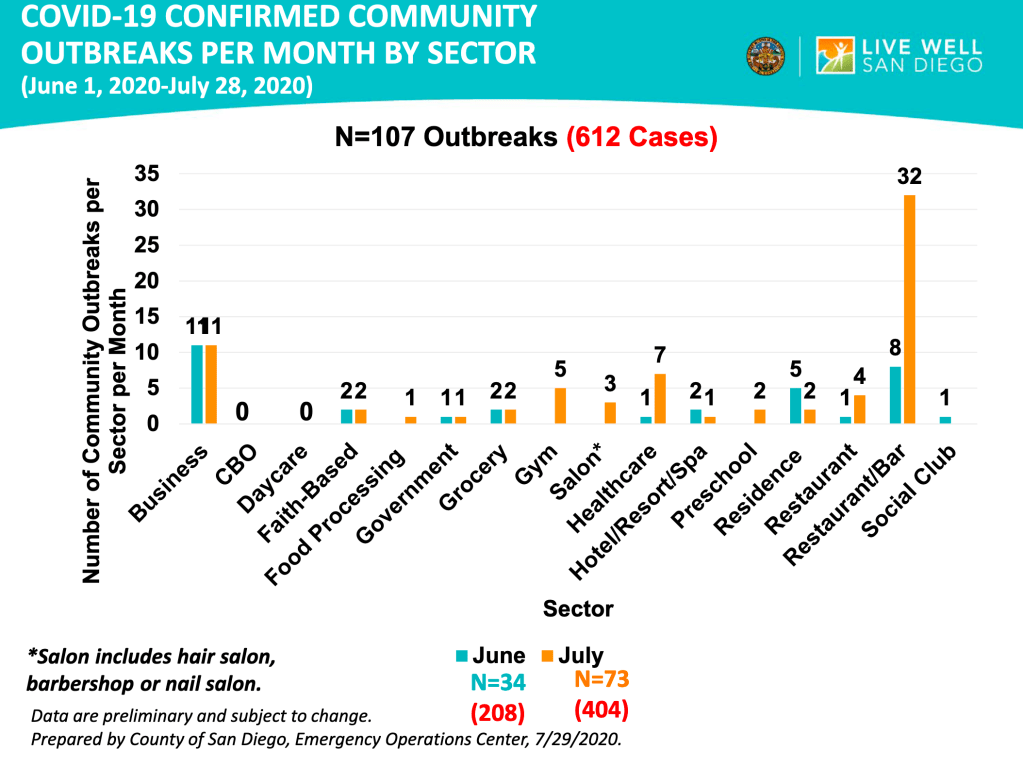
The location of outbreaks in San Diego County: San Diego Public Health has published a graph on the locations of outbreaks as part of their regular slide package. Out of 134 the top most common places for outbreaks are restaurants with a bar (40), businesses (27), the healthcare environment (15), and residences (9), further down the list, faith based organizations and government offices are tied at 5. As a business traveler myself, I’m happy to see that hotels are only at 3. Restaurants without a bar only had 5 events.
Things are starting to get better! But remember that an epidemic is like a wildfire, getting containment doesn’t mean it’s over! We need to remain diligent in order to put it down for good. Keep up your efforts!
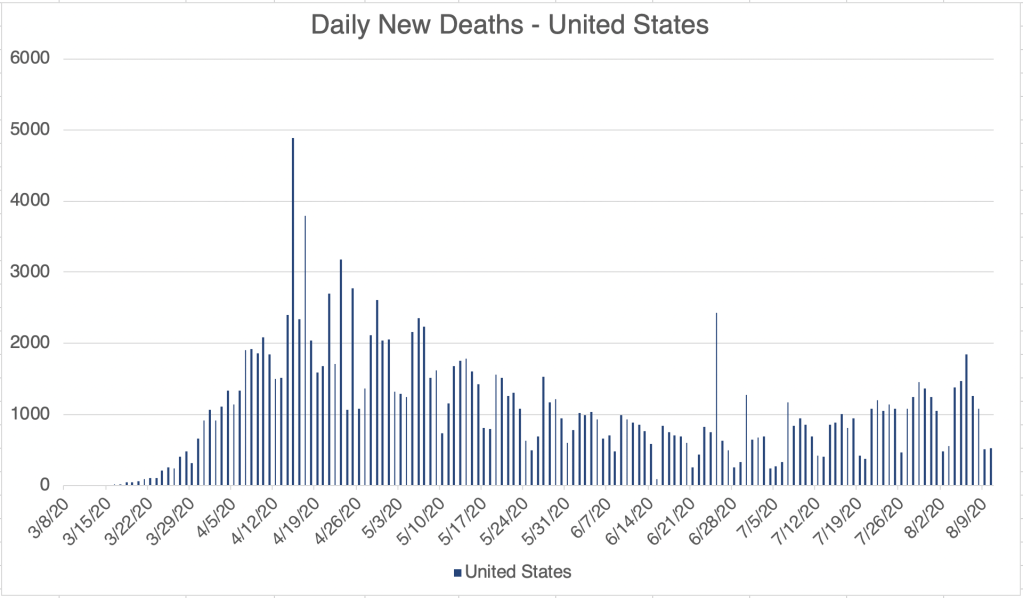
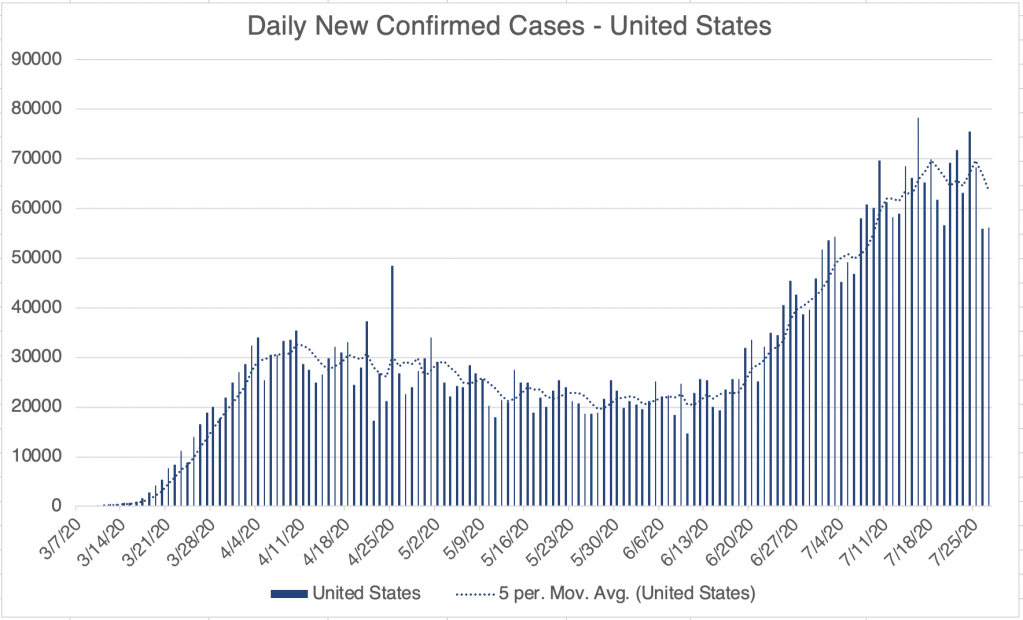
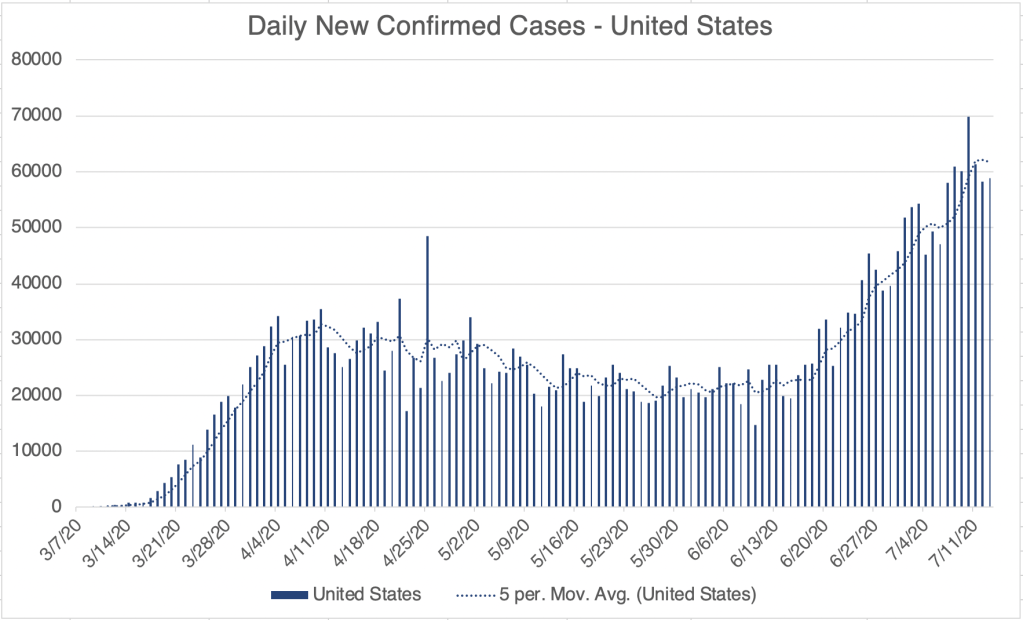
Some more good news this week. The United States has unambiguously reached the peak of wave 1b, and daily new confirmed cases are slowly going down. Daily deaths have risen slightly, trailing the higher new cases by a few weeks, but are still relatively low.
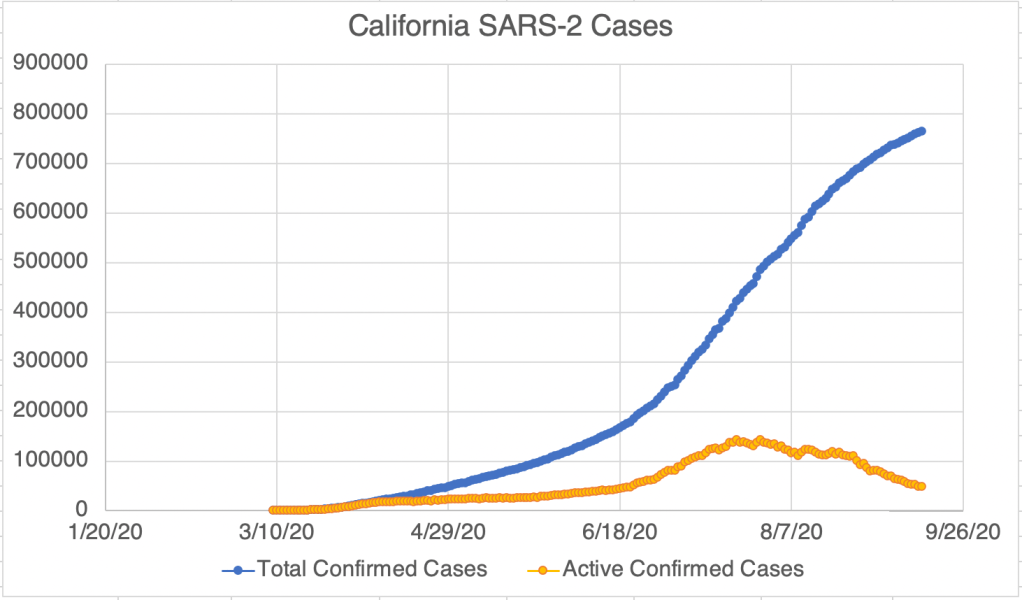
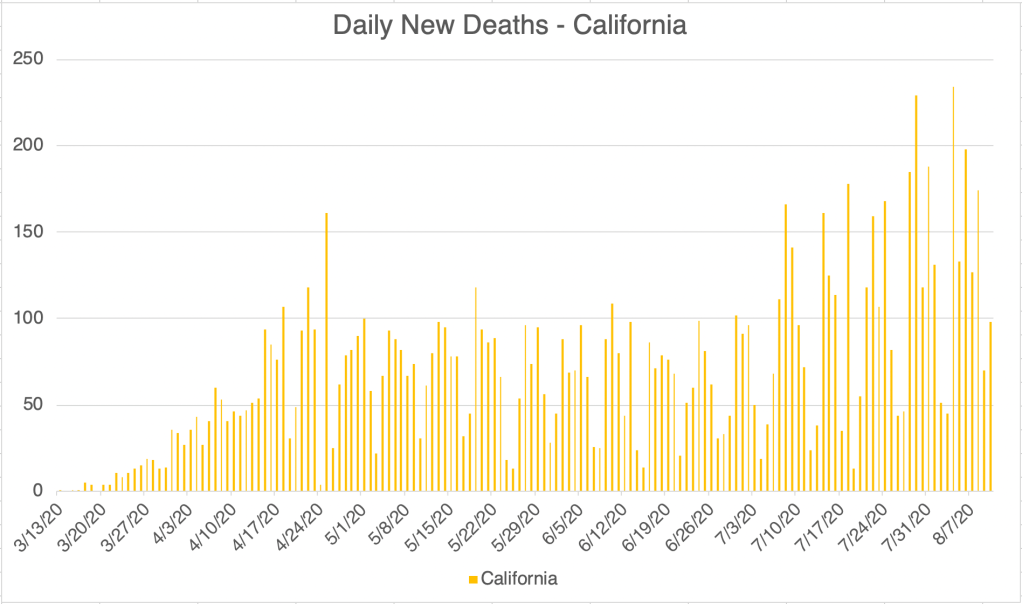
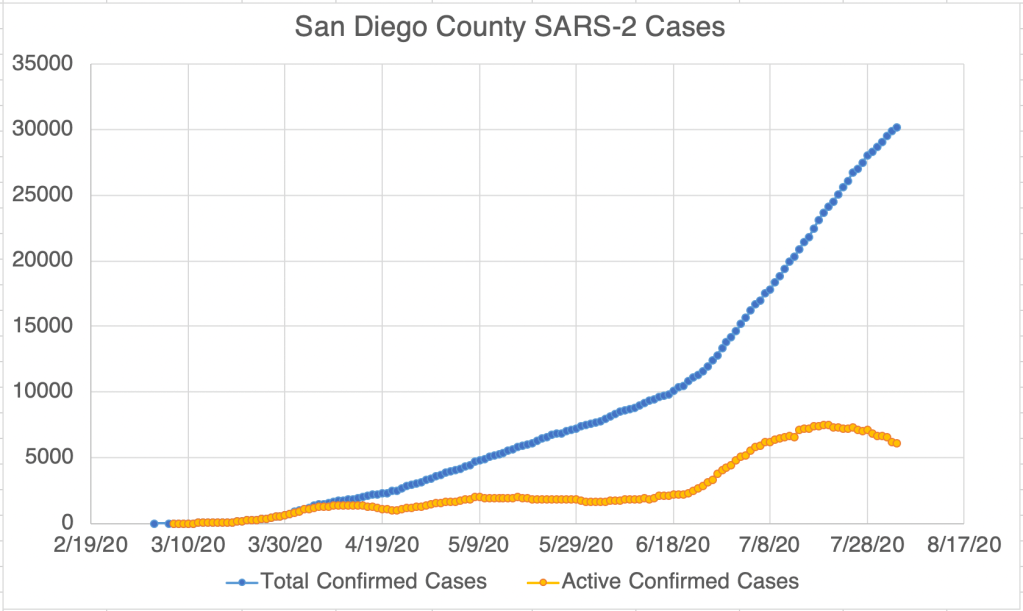
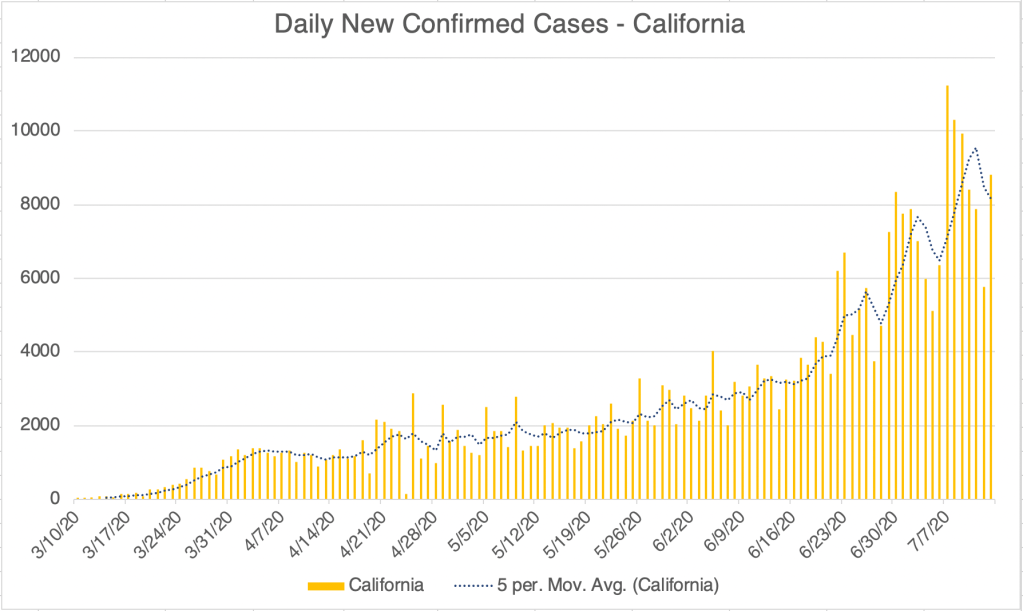
The situation is much the same in California and San Diego, with new daily cases coming down and daily deaths rising slightly. Active cases are probably starting to go down as well.
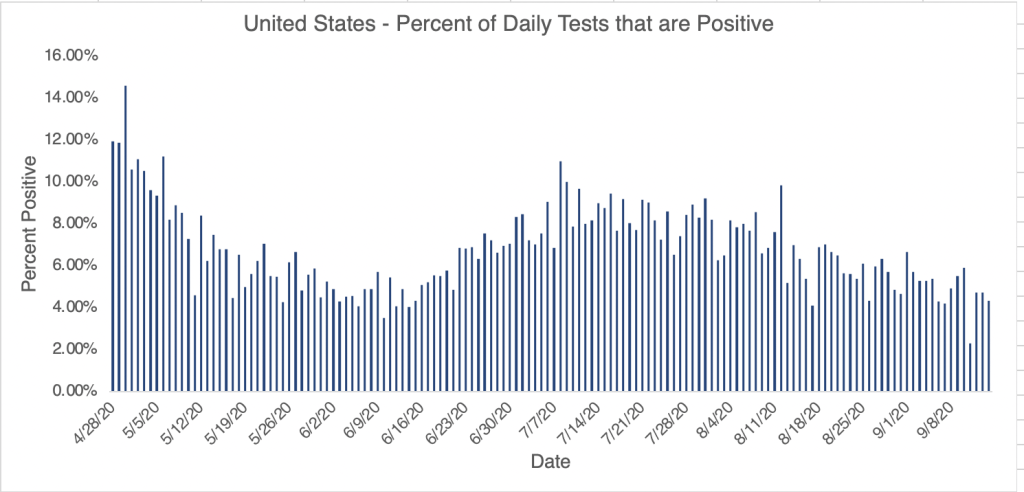
Testing continues to rise and it is having some impact on the increasing confirmed numbers. The higher testing is definitely a positive thing and will help us get a more accurate picture of what’s going on.
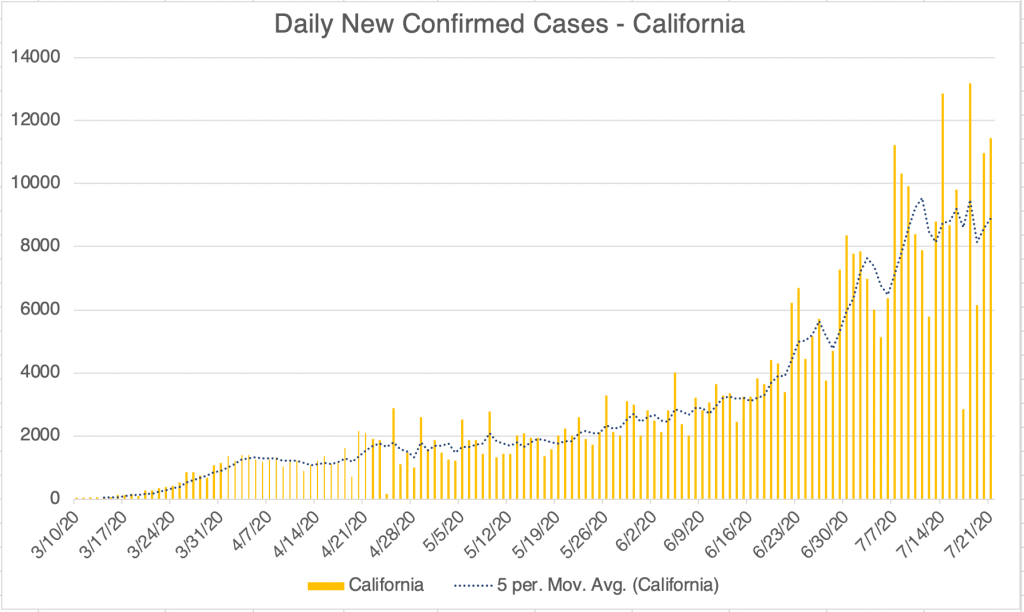
Happily, there is some good news about the virus this week. For the US and California, the number of daily new cases suggests that for both regions, we may have hit a peak in new cases. Sunday or Monday is always the low number for the week, but the number of new cases on those days usually predicts the peak for the rest of the week. For both, this week’s low is near or below last week’s low, suggesting that the high for the week will be near or lower than the high for last week.
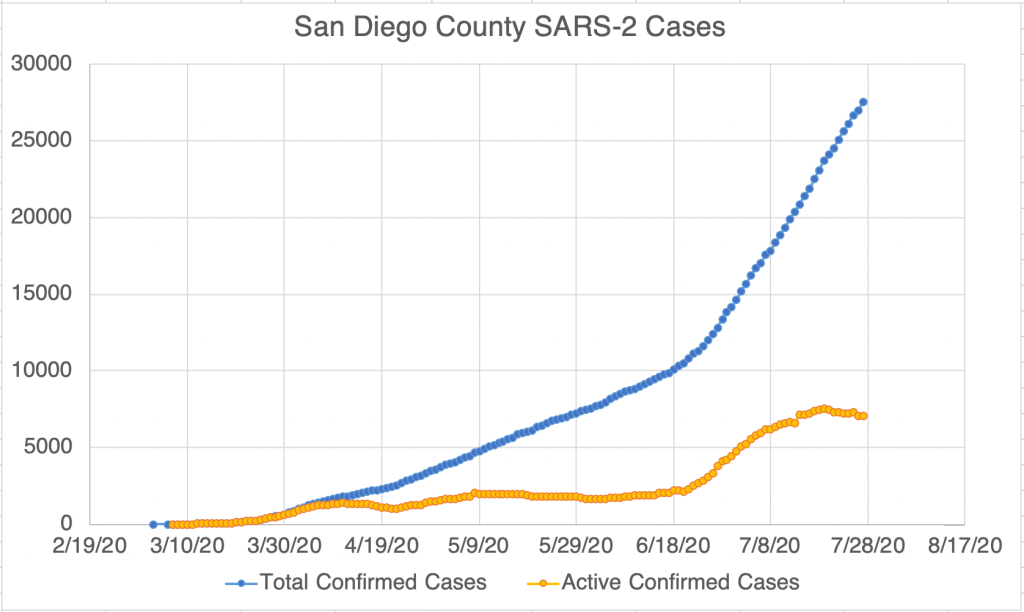
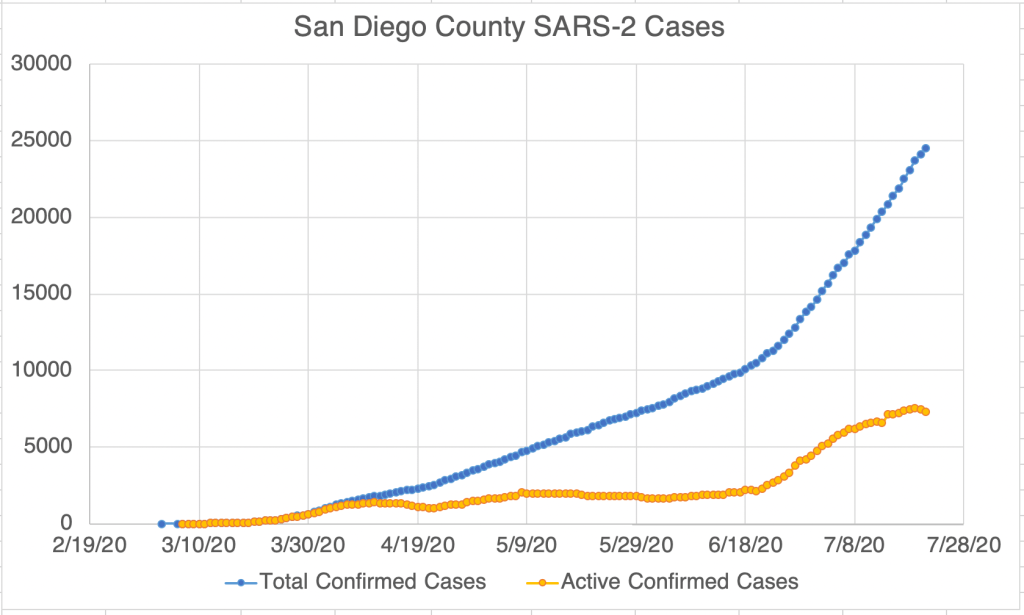
San Diego has been flat since early July. New cases aren’t going down yet, but they aren’t going up anymore either. In addition, the number of active cases in San Diego is probably going down, after a peak of almost 8000 active cases. Unfortunately, California overtook New York for the number of confirmed cases in the country this week, and LA County has the most new cases in the entire country, and has 40% of confirmed cases in California.
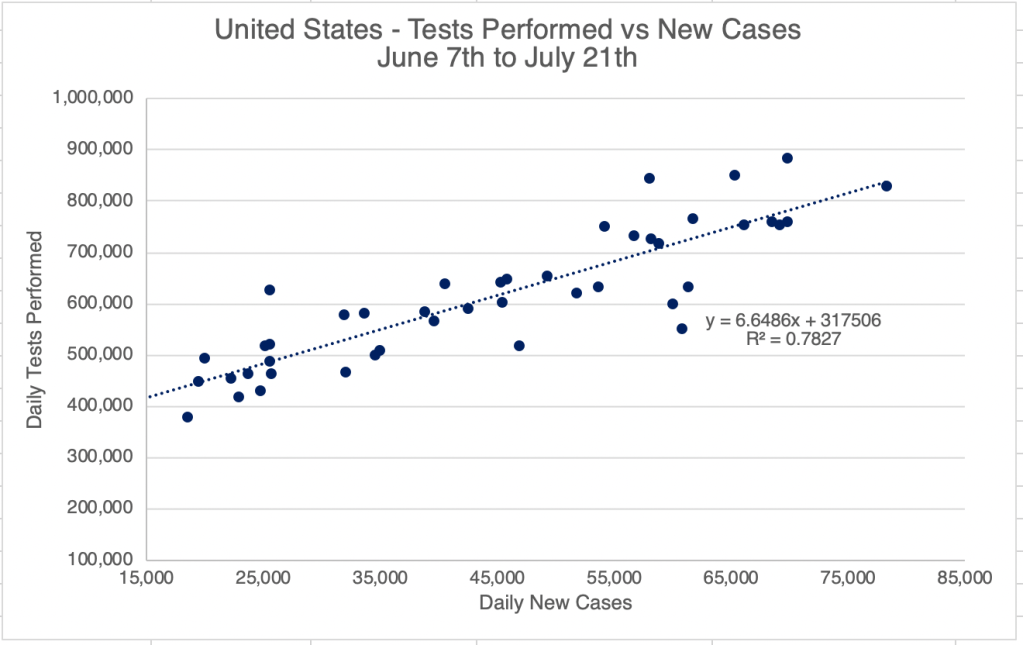
As we discussed in May 12thpost on new cases, comparing the number of tests and new cases can tell us if all the new cases are just related to new testing. An R2 number between 0.95 and 1.00 shows strong correlation, “proof” that two things are related. The tests vs cases for the US since early July give an R2 of 0.78. This suggests that though many of the cases are real, at least some are because of new testing. In California the R2 is 0.44, a much weaker relationship, meaning more of the new cases are not just due to more testing.
An R2 number of above 0.95 suggests good correlation, a number of 0.78 suggests that while there is a contribution from increased testing, some of the increase is real new cases. Graph is by me, from data collected from Johns Hopkins University COVID site.An R2 number of above 0.95 suggests good correlation, a number of 0.44 suggests that while there may be some contribution from increased testing, much of the increase is real new cases. Graph is by me, from data collected from Johns Hopkins University COVID site.
Rt Live shows that more states have an Rt number of less than 1.0, indicating that the virus is slowly going away in that state.
I have some African readers, so I’ll point out that the number of new cases appears to have peaked in Nigeria, DR Congo, Malawi, and South Africa, as well as in Brazil, a country which now has the 2nd highest number of confirmed cases, behind the US. Let’s hope we can keep this progress going!
This is a case update. For the US and California, cases continue to rise. The number of daily deaths have begun to rise as well in the last week, running about 3 weeks behind the rise in daily confirmed cases.
The news is better in San Diego. Daily new cases has flattened and may even be going down. A caution is always that Sunday and Monday are always low days of the week in terms of new cases, so you have to be careful about saying things are getting better on a Tuesday! The number of active cases in San Diego may be flattening as well.
After a spike in cases in Imperial County, east of San Diego, hospitals in El Centro have become overwhelmed and COVID patients are being sent to San Diego, Orange and other counties. This stresses the importance of keeping case loads low so as not to overwhelm hospitals and ICU deparments.
Texas Medical Association Chart: The Texas Medical Association released a very helpful chart giving the relative risks of different activities.
If you’ve reading my posts, you won’t be very surprised by the entries, they are pretty consistent with what I’ve thought myself.
The information was obtained by polling Texas doctors, so the data probably reflects what they know about their own patient’s histories, and also probably some opinion.
Budesonide: A very interesting video was posted last week featuring Dr. Richard Bartlett. He claims to have a very effective new treatment, using a nebulized anti-inflammatory normally for asthma, Budesonide. It will be very interesting to watch if others have success with this method.
The video introduces another topic that is very timely. If you watch the whole video, you’ll notice that Dr. Bartlett has some views about the virus that I don’t share. However, I think the video is still worth watching. Often these days, people dismiss people with whom they disagree on any topic. In reality, it’s very common to be able to take at least some truth from those with whom we disagree. In fact, on complicated topics, I find that with almost anyone I read or watch, even people I respect highly, there is often some topic that I think they’re wrong about. If I refuse to learn from people that I disagree with, I’d have to quit listening to most of the people I respect! With all that’s going on in the US right now, we will need to listen to and learn from all kinds of people to move forward. Even if you disagree, learning a person’s position will help you understand the topic better.